GIGFX Daily Economic Analysis
GIGFX Daily Economic Analysis
EURUSD analysis 15-10-10
For the 1ST time the EURO pass the 1.4100 level from about nine months, where the pair achieved 1.4122 to form a top at this level which pushed the pair down in order to correct the last bullish move and also to retest the neck line for the inverted head and shoulder pattern, that locates in between 1.4010 and 1.4027.
The pair formed a bottom at this area which pushed up the pair to retest 1.4122 level; if the pair is able to break this level then it will continue rising and it may reach 1.4250 that represents the target for the inverted head and shoulder pattern.
This expectation depends on the stability of the support level 1.4010.
Res: 1.4152, 1.4221, 1.4320
Sup: 1.3984, 1.3885, 1.3816
Thursday 21-10-2010 Technical Analysis
EURUSD
The pair reached 1.3697 as the lowest price to form a bottom there; then rose to form a top at the level 1.3880 that could not stop the pair rising, to reach again 1.3990 yesterday.
About the last trades the pair retested 1.3880 support level to lead the expectation that the pair may form a bottom at this level to push the pair up to continue the bullish movement. it is expected that the pair may be forming an inverted head and shoulder pattern, the pattern that considers a reflecting pattern for the last bearish move and it also considers a continues pattern for the medium and long directions, and it is expected after the pair forms the right shoulder; that it will continue rising to break the pattern neck line to target 1.4275 that represents the target for the pattern and also represents 127% continues level for the bearish direction from 1.4150 to 1.3697, but in order to reach that target the pair must break the resistance level 1.4150.
This expectation depends on the stability of the support level 1.3830.
Res. 1.3955 1.4000 1.4042
Pivot 1.3913
Sup. 1.3868 1.3826 1.3781
GBPUSD
On the contrary of the last expectation, the support level 1.5700 succeeded to hold against the pair testing, which led the pair to rise during yesterday trades then reached the resistant level 1.5855 in order to retest it, if this level held against the pair testing, it is supposed for the pair to fall again targeting the support level 1.5700 then the support level 1.5565 which represents the target for breaking the bullish channel.
But in case of breaking the resistant level 1.5855, the pair will end its bearish corrective period in order to continue the bullish direction for the medium period targeting the resistant level 1.6000, with the possibility of breaking it.
Res. 1.5932 1.6018 1.6159
Pivot 1.5791
Sup. 1.5705 1.5564 1.5478
USDJPY
The pair is still falling for the medium and the long periods moving between a bearish channel lines, during the last short trades a confusion area that was formed between the resistance level 81.65 and the support level 80.89 and this area formed a triangle pattern and it's expected that this pattern will continue supporting the bearish directions with breaking the bottom line for the pattern at the support level 80.89 and what supports this pattern is a continuous pattern for the bearish direction is continuing the bearish move inside this bearish channel , after breaking the bottom line for the pattern ; the pair will be able to target the level 80.13
Res. 81.54 82.01 82.36
Pivot 81.19
Sup. 80.72 80.37 79.90
USDCHF
At the intraday levels during the last two days, the pair is in a bullish direction inside a channel that is still forming, as noticed yesterday; the pair tested the top line of this channel which is located at the level 0.9739 and represents 38.2% correction level for the last bearish move for the medium period, from which the pair reflected to reach the bottom levels of the channel that is located at the support level 0.9635, which is still stable till now. It is important to note that, those levels are the determiners of the pair direction during the next trades for the short period, and if the pair succeeded to break any of each, there will be a possibility of; if the direction was a bearish one, the pair will target the support level 0.9500, and if it was a bullish one, the pair will target the resistant level 0.9820 which represents 50% of the same previous levels.
RES. 0.9698 0.9781 0.9844
Pivot 0.9635
Sup. 0.9552 0.9489 0.9406
USDCAD
As was expected yesterday; the pair succeeded to form a top at 1.0346 level to push down the pair to retest the support area between 1.0215 and 1.0205 that represents 61.8% correction level for the bearish move from 1.0346 to 0.9977, the pair formed a bottom at this level using it to rise during the last trades in order to search a good resistance level, and it is expected that the pair will form a top at the level 1.0259 that may push down the pair in order to retest the mentioned support level, and if the pair was able to pass this level with breaking the bullish trend line for the short period; the pair will fall continuing the bearish direction to target the support level 1.0064.
This expectation depends on the stability of the resistance level 1.0315.
Res. 1.0302 1.0396 1.0443
Pivot 1.0255
Sup. 1.0161 1.0114 1.0020
AUDUSD
It was expected through yesterday's report that, the pair will continue rising in a try to form a new top that was expected to form at the area between the resistant level 0.9830 and the level 0.9871 which represents 61.8% correction level of the bearish direction for the short period (from 1.0000 to 0.9960), and that was achieved by forming this top at the level 0.9871. It is expected for the next trades that, if the pair tends to continue forming the bullish direction for the medium and long periods, it should break the resistant level 0.9871 with breaking the bearish trend line for the short period to continue rising and reach the level 1.000 again.
This bullish movement depends on the stability of the support level 0.9790 because, breaking this level means the returning to form the bearish direction for the short period and the possibility of falling again to reach the level 0.9960.
Res. 0.9952 1.0034 1.0179
Pivot 0.9807
Sup.0.9725 0.9580 0.9498
Monday 25-10-2010
EURUSD
The G 20 meeting affected the last week trades, where it caused confusion around rising and declining, but the support level 1.3880 always stopped the pair falling, the support level that represents the right shoulder for the head and shoulders pattern that was mentioned before, the stability of this level gives the confirmation for the pair rising above the pattern neck line.
With this week opening the pair made a bullish gap that the pair was able to cover it through the previous trades, which also confirms the pair ability to continue rising for the medium and long trades, to lead the expectations for more rising through the next trades in order to target the 1.4275 that represents the target for the pattern and also represents the 127% continues level for the bearish move from 1.4150 to 1.3697; but in order to reach that target the pair must break the resistance level 1.4150.
This analysis depend on the stability of the support level 1.3880.
Res. 1.3988 1.4033 1.4097
Pivot 1.3924
Sup. 1.3879 1.3815 1.37770
GBPUSD
The support level 1.5700 succeeds to block the pair falling for the second time; this level held against the pair retesting which the price could not break, the pair rise up again with the beginning of this week trades expecting for it more rising during the intraday trades trying to retest the resistance level 1.5855; if the pair breaks this level; it will immediately target the resistance level 1.6000.
This expectation depends on the stability of the support level 1.5700 and any break for this level means targeting the support level 1.5565.
Res. 1.5741 1.5794 1.5839
Pivot 1.5696
Sup. 1.5643 1.5598 1.5545
USDJPY
The pair is still trading between the lines of the rectangle pattern, but during the last intraday trades it is noticed that the pair attempts to break the support level 80.89 which represents the bottom line for the pattern, the confirmation of breaking this level during the next trades means the confirmation that the pattern is completing the bearish direction which controls the pair movement for the medium and long periods, in this case, it is expected that, the pair will fall targeting the level 80.13 which represents the target for the pattern in this bearish case.
The stability of these expectations depends on the stability of the resistant level 81.65.
Res. 81.58 81.80 82.10
Pivot 81.28
Sup. 81.06 80.76 80.54
USDCHF
The pair is moving inside a bullish channel for the short period, at the end of the last week trades, the pair succeeded to rest the top line of this bullish channel and used it to reflect back trying to test the bottom line of this bullish channel almost at the level 0.9680, if this level held against the pair testing, it is normal to notice more rising during the intraday trades of today targeting the resistant level 0.9820.
But in case of breaking this bullish channel in which the pair is moving inside, means the failure of completing the bullish corrective movement for the pair and means the continuation of the bearish movement for the medium period targeting the support level 0.9500 again but under the condition of breaking the support level 0.9635.
RES. 0.9837 0.9893 0.9982
Pivot 0.9748
Sup. 0.9692 0.9603 0.9547
USDCAD
During the last week trades the pair retests the resistance level 1.300 which represents the( C ) point for the harmonic pattern ( AB=CD ), the pair didn't succeed to break up this level to give a new signal for the strength of the pattern and for the pair declining to retest the support level 1.0175 which represents the ( B ) point, expecting with breaking this level the pair will continue falling to form the rest of the rib ( CD ) which ends at the level 1.0095 which represents the Completing ( D ) point for the harmonic pattern.
This expectation depends on the stability of the support level 1.0300.
Res. 1.0309 1.0346 1.0389
Pivot 1.0266
Sup. 1.0229 1.0186 1.0149
AUDUSD
The pair is tending to form a head and shoulders pattern, which was mentioned last week, that pattern supposed to reflect the bearish direction for the short period, and to continue the bullish direction for the medium and long periods, and with the stability of the support level 0.9750 and this week opening the pair formed a rising gap which pushed the pair to break the pattern neck line, the pair was able to cover the gap to continue the new bullish direction that targets 1.0000 level, and breaking this level means more rising in order to reach the resistance area between 1.0095 that represents 127% continues level for the bearish move from 1.0000 to 0.9960 and 1.0120 level which represents the target for the pattern.
Res. 0.9862 0.9905 0.9957
Pivot 0.9810
Sup.0.9767 0.9715 0.9672
Wednesday 27-10-2010 Technical Analysis
EURUSD
The new American data that was released yesterday and the falling of the yen again are the main reasons that brought the strength to the American currency against the major currencies, so that, the euro retreated against the dollar during yesterday trades, this falling has been confirmed by breaking the bullish trend line for the medium period with the breaking of the support level 1.3880, this bearish movement means the failure of the head and shoulders pattern that has been referenced at the previous reports, all these provide a strong signals to the bearish direction at the last trades for the short period.
Now the pair is in its way to reach the level 1.3795 which represents 23.6% correction level for the bullish direction (from1.2644 to 1.4150). Breaking this level means more falling to reach the support level 1.3695, but if the pair failed to break the support level 1.3795, it is expected that, the pair will rise again to retest the level 1.3880 which became a resistance level after its breaking down. Breaking up this level again will confirm that, the pair is tending to rise again to reach the resistance level 1.3985.
Res. 1.3951 1.4044 1.4107
Pivot 1.3888
Sup. 1.3795 1.3732 1.3639
USDCHF
The pair is moving inside a bullish channel for the short period, and through the last periods the pair was able to reach this channel top line after the support level held and pushed the pair to pass the resistance area between the level 0.9805 and 0.9777 that represents 38.2% correction level for the bearish move from 1.0278 to 0.9467, to finally reach the 50% correction level.
And through the current trades the pair is facing the channel top line with facing 50% correction level, which form a good resistance that stopped the pair bullish move, this resistances may push down the pair to search for a good support in order to continue the previous short bullish move, and this support is expected to be at the level 0.9777, which if held it may push the pair up to break the 50% correction level, but in case the pair broke down 0.9777 level it may have more falling in order to retest the channel bottom line.
RES. 0.9916 0.9988 1.0095
Pivot 0.9809
Sup. 0.9737 0.9630 0.9558
USDCAD
During yesterday trades the pair didn't try to break the support level 1.0155 ; so that the pair rose again to retest the resistance level 1.0300 which represents the ( C ) point for the harmonic pattern ( AB=CD ) and if the pair succeeded to break this level during the next trades it means more rising in order to target the level 1.0373 , in case of the pair falling again it will retest 1.0155 which with its breaking, the pair will continue falling to the level 1.0095 which represents the expected ( D ) point for the harmonic pattern.
Res. 1.0275 1.0313 1.0360
Pivot 1.0228
Sup. 1.0190 1.0143 1.0105
AUDUSD
The appearance of the consumer confidence for the AUD by a less than expected forced the pair to fall again ignoring all the signals which was supporting the continuous bullish directions such as the bullish continues head and shoulders pattern for the medium and the long periods and the reflective bearish directions for the short period; during the intraday trades the pair is trying to break the support level 0.9750 to reach the level 0.9710 which represents 23.6% correction level for the bullish move ( from 0.8770 to 1.0000 ) which with breaking it and breaking the bullish trend line for the medium and the long periods the pair will continue falling to the level 0.9660 , if the bearish force dominates the pair, it's expected that the level 0.9660 will be broken to target the level 0.9530 which represents 38.2% correction level for the mentioned same bullish direction.
This expectation depends on the stability of the support level 0.9795.
Res. 0.9914 0.9976 1.0026
Pivot 0.9864
Sup.0.9802 0.9752 0.9690
GBPJPY
After forming the harmonic pattern AB=CD that noticed in this chart, the pair reflected up after facing the support level 126.70, with an aggressive rising, the pair broke the resistance level 128.40, and the trades are above this level till now with the possibility that the pair may retest this level in order to continue the bullish direction which the pair started it yesterday.
What confirms the rising of the pair during the intraday trades of today is the breaking of the bearish channel lines which the pair was moving between.
So, it is expected that, the pair will target the resistance level 130.70 in order to test it, and which if couldn't be stable against the pair breaking; the pair will target the resistance level 131.83.
Res. 129.84 130.65 132.16
Piv. 128.33
Sup. 127.52 126.01 125.20
Clients of GIGFX who has a real account can be able to see FULL Version for all 16 Currencies in member area section.
is it those one of those 7 price level must be true ??? ??
Tuesday 11-01-2011 Technical Analysis Report
EURUSD
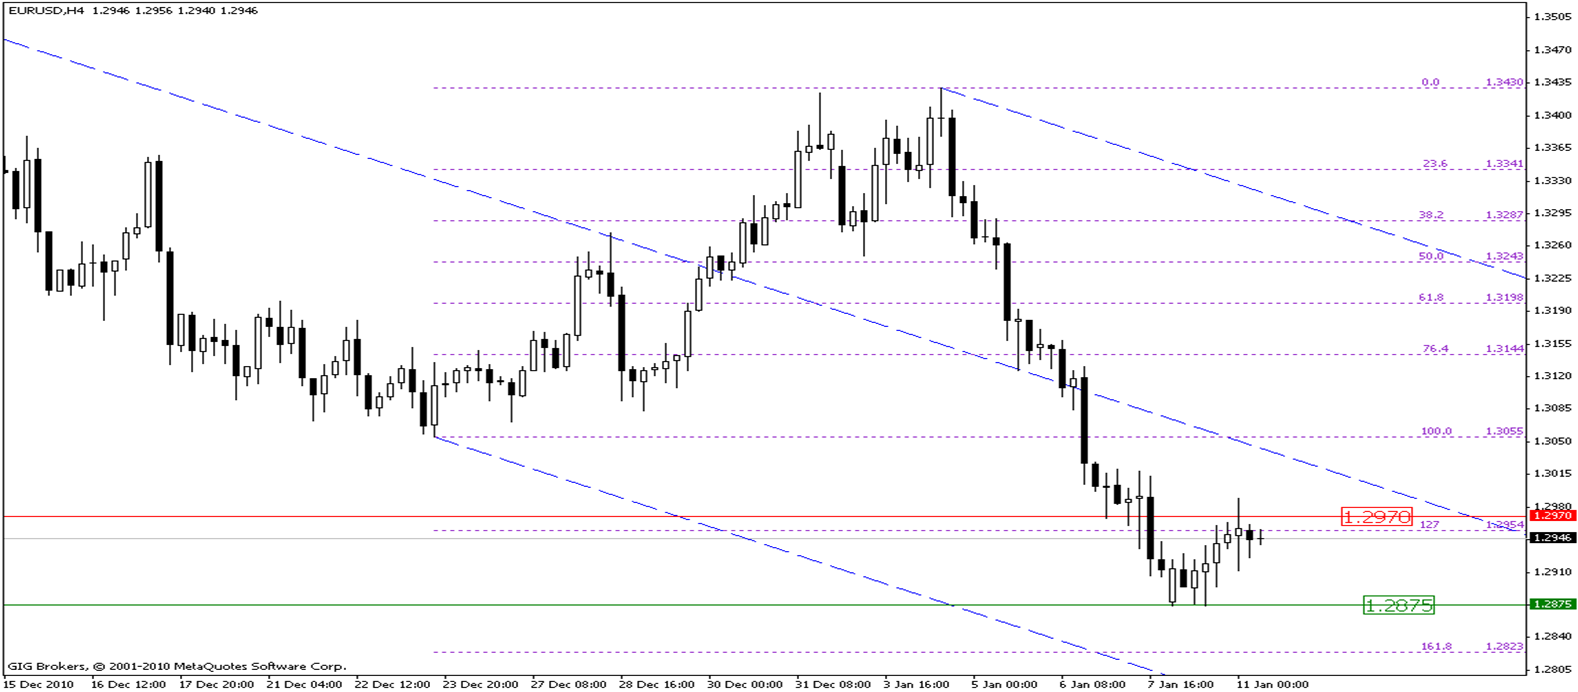
The bearish direction is still dominating the pair trades till now whereas, the pair continued declining during yesterday trades forming a new bearish bottom at the level 1.2875, the pair used this bottom to push rising to re-test the nearest resistance levels. till now the pair is still unable to pass the resistance level 1.2970 so, if this level continued stable, it is expected that the pair will decline again to re-test the support level 1.2875 which with its breaking down means continuation of forming downtrend till reaching the level 1.2823 which represents 161.8% Fibonacci continuous level for the bullish direction (from 1.3055 to 1.3430). In the case that the pair succeeded to overcome the resistance level 1.2970 means the beginning of a corrective uptrend for the last bearish wave targeting to reach the level 1.3055.
Res. 1.2985 1.3019 1.3075
Pivot 1.2929
Sup. 1.2892 1.2832 1.2805
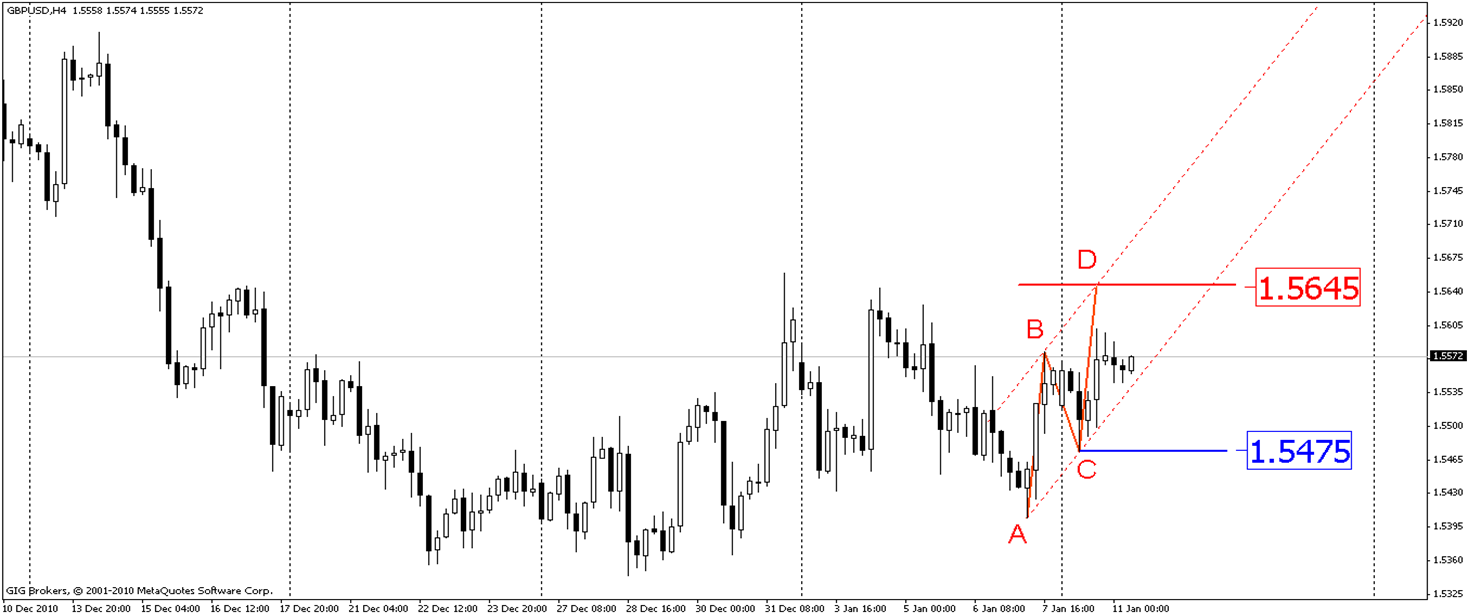
GBPUSD
As it was expected yesterday, the trades of the pair were confused whereas, the pair declined and reached the support level 1.5475 to collect the needed momentum in order to continue rising and close above the resistance level 1.5560. The pair now is almost finishing the stage of forming the harmonic pattern AB=CD to target then the resistance level 1.5645 during the intraday levels for today finishing the last rib of the pattern (CD) at this level.
The stability of these expectations requires the stability of the support level 1.5475.
RES. 1.5625 1.5678 1.5753
Pivot 1.5549
Sup. 1.5497 1.5421 1.5369
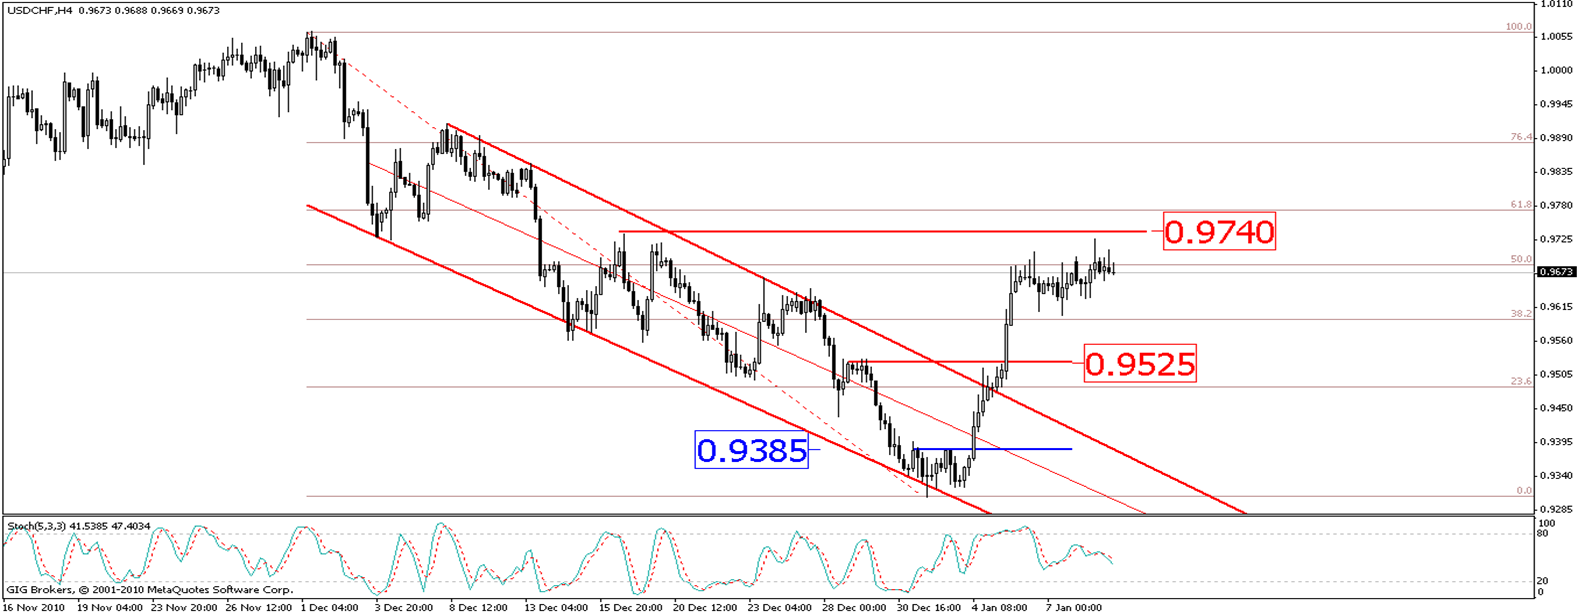
USDCHF
Yesterday, the pair succeeded to reach the resistance level 0.9740 but shifted down just when reached it, moving in a sideways direction during the last two days with the expectations of more rising during today's trades, but it is not recommended to have any bullish positions until breaking the resistance level 0.9740 in order to be the target of the pair is reaching the resistance level 0.9880 to test it which represents 76.4% Fibonacci correction level for the last medium-term bearish wave.
The stability of these expectations requires the stability of the support level 0.9595.
RES. 0.9724 0.9774 0.9821
Pivot 0.9677
Sup. 0.9627 0.9577 0.9530
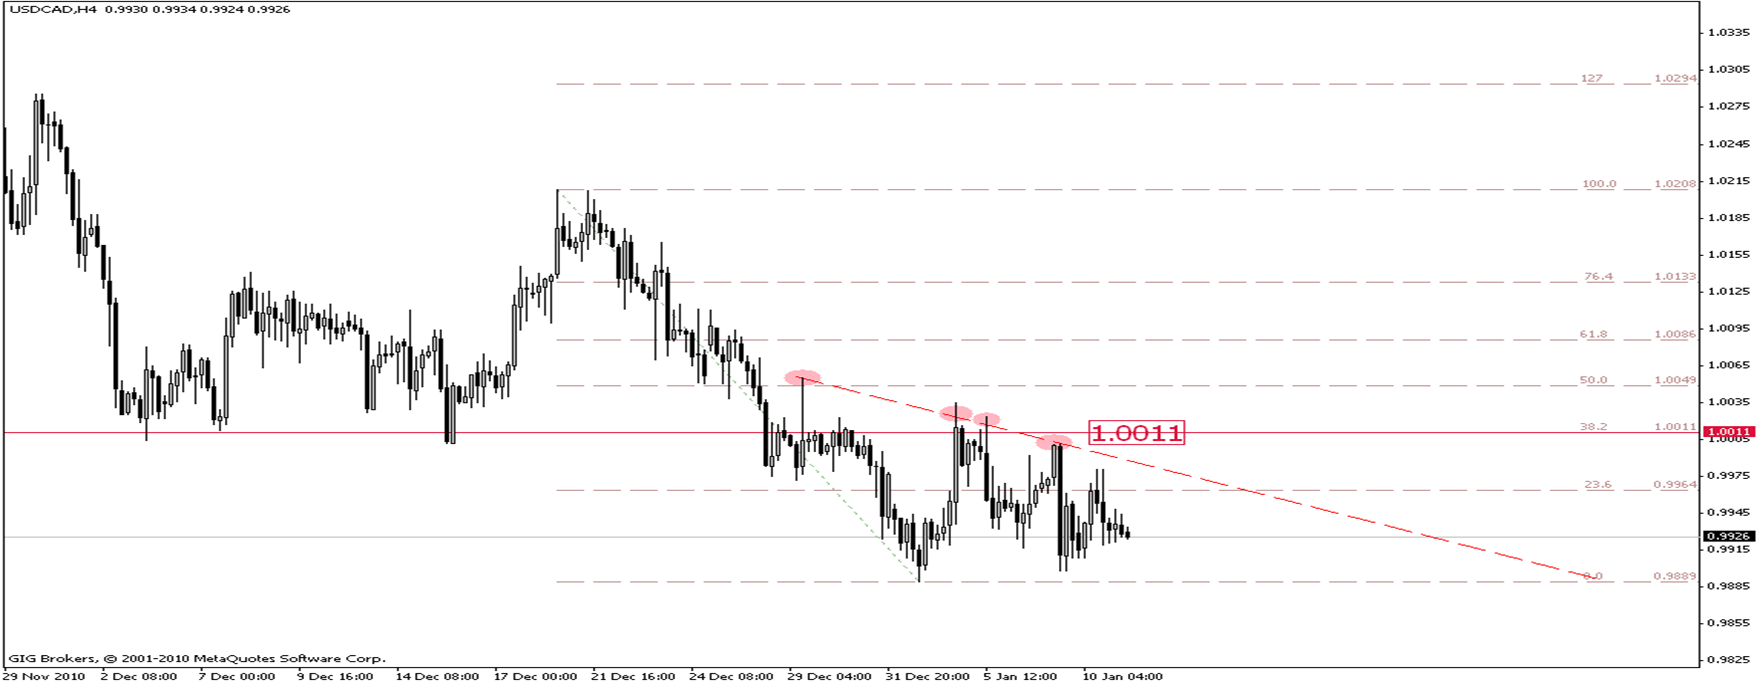
USDCAD
Yesterday, the pair trades were in a narrow range, confused and volatile, this narrow trades is needed in collecting the momentum which will the pair use to form the next trades direction. if the pair breaks the support level 0.9889, it will continue falling till reaching the next support level at 0.9830 and in case of breaking the bearish trend line for the short-term, the pair will continue rising till the resistance level 1.0011which also with breaking it up the pair will be able to form the bullish correction direction for the last bearish direction which has started from the level 1.0208
Res. 0.9971 1.0012 1.0044
Pivot 0.9940
Sup. 0.9899 0.9868 0.9827
AUDUSD
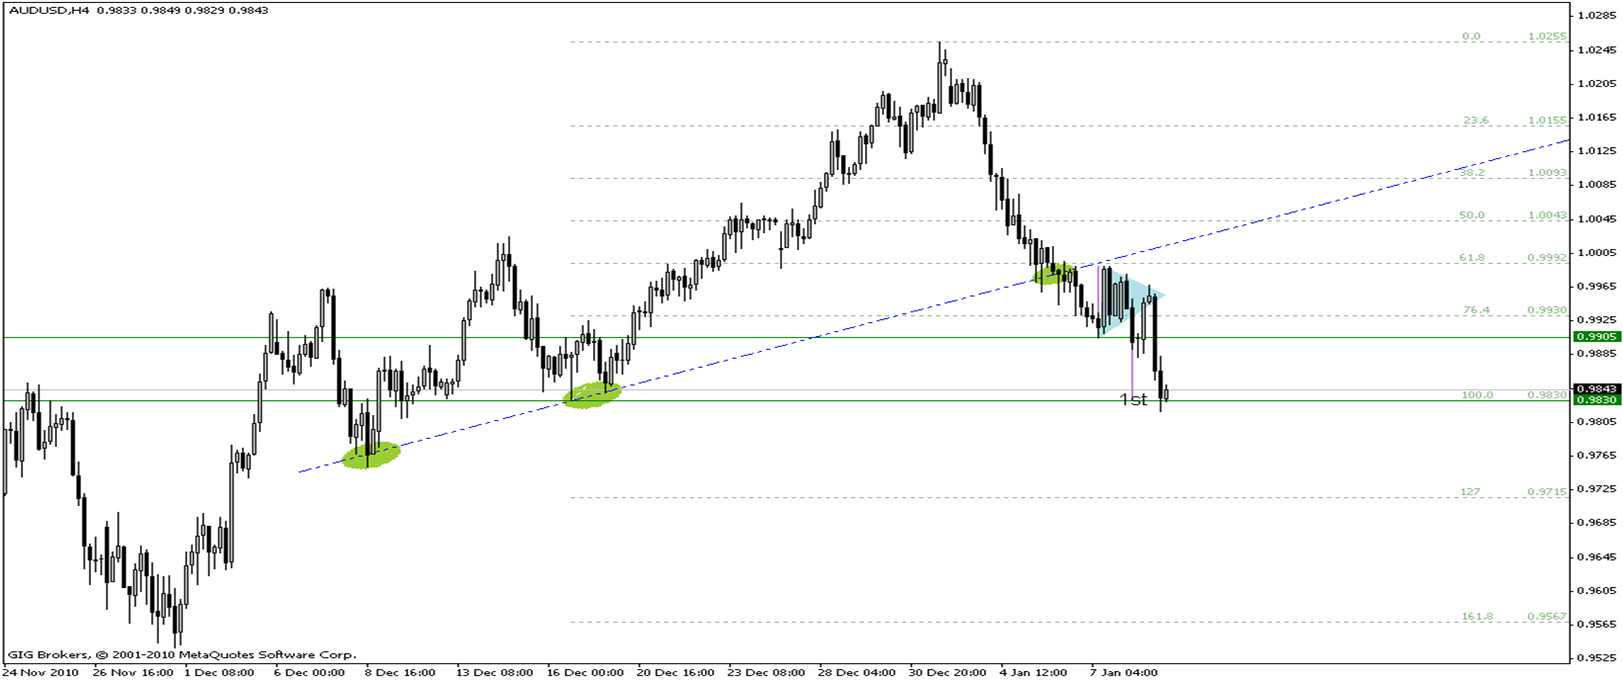
The pair direction is still the bearish direction for the medium and the short-terms, as mentioned in yesterday report, the pair is a bearish targeted price for the symmetrical triangle by reaching the support level 0.9830 which was achieved during the last intraday trades, expecting a force on the pair trades that will continue falling to reach the level 0.9715 which represents 127% Fibonacci retracement continuous level for the bullish direction ( from 0.9830 to 1.0255 ) reaching this targeted price; the support level 0.9830must be broken with a good close below it.
This expectation depends on the stability of the resistance level 0.9905
Res. 0.9995 1.0036 1.0093
Pivot 0.9938
Sup. 0.9897 0.9840 0.9799
Clients of GIGFX who has a real account can be able to see FULL Version for all 16 Currencies in member area section.
To know more about out Christmas Promotion, please visit:
Global Investment Gate | GIGFX Bonus 2010
25$ bonus account promotion is Extended !!
Monday 17-01-2011 Technical Analysis
EURUSD
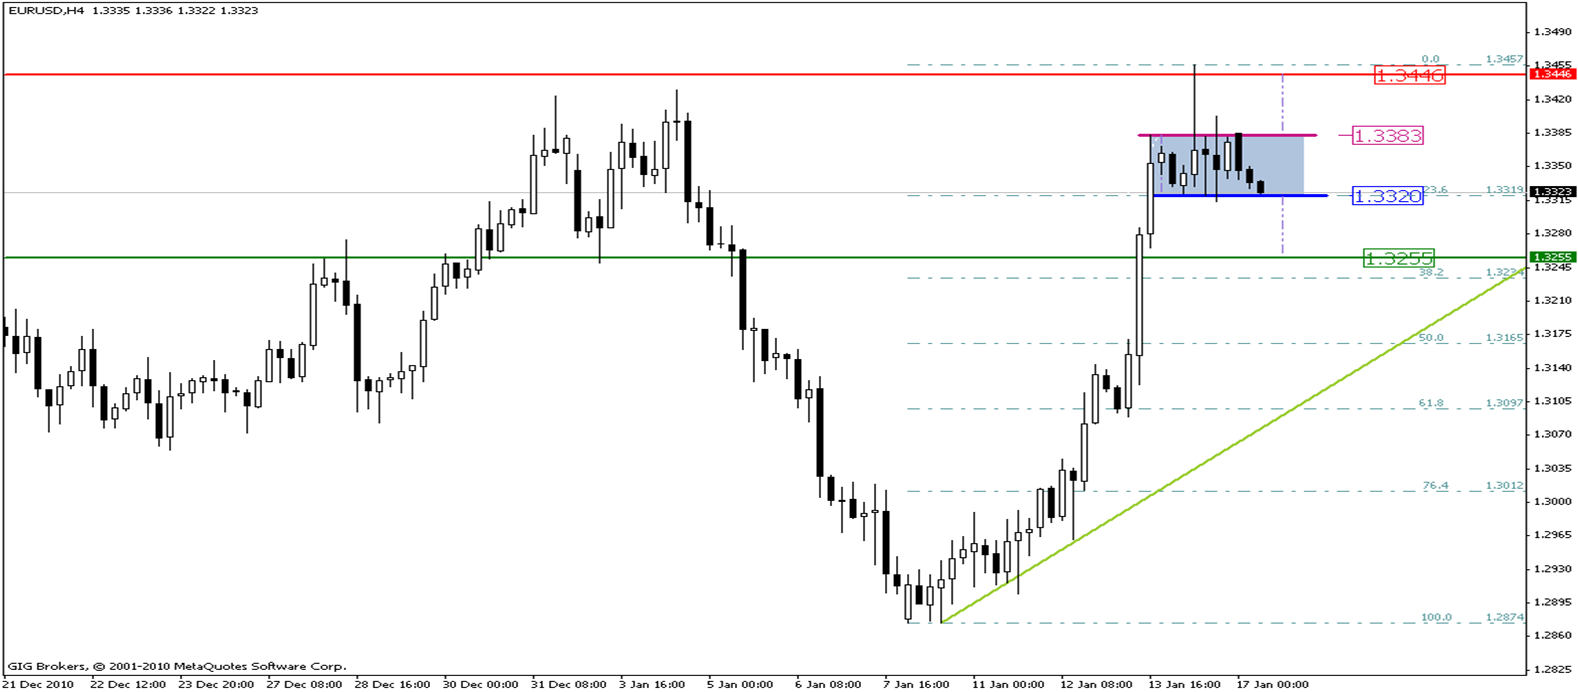
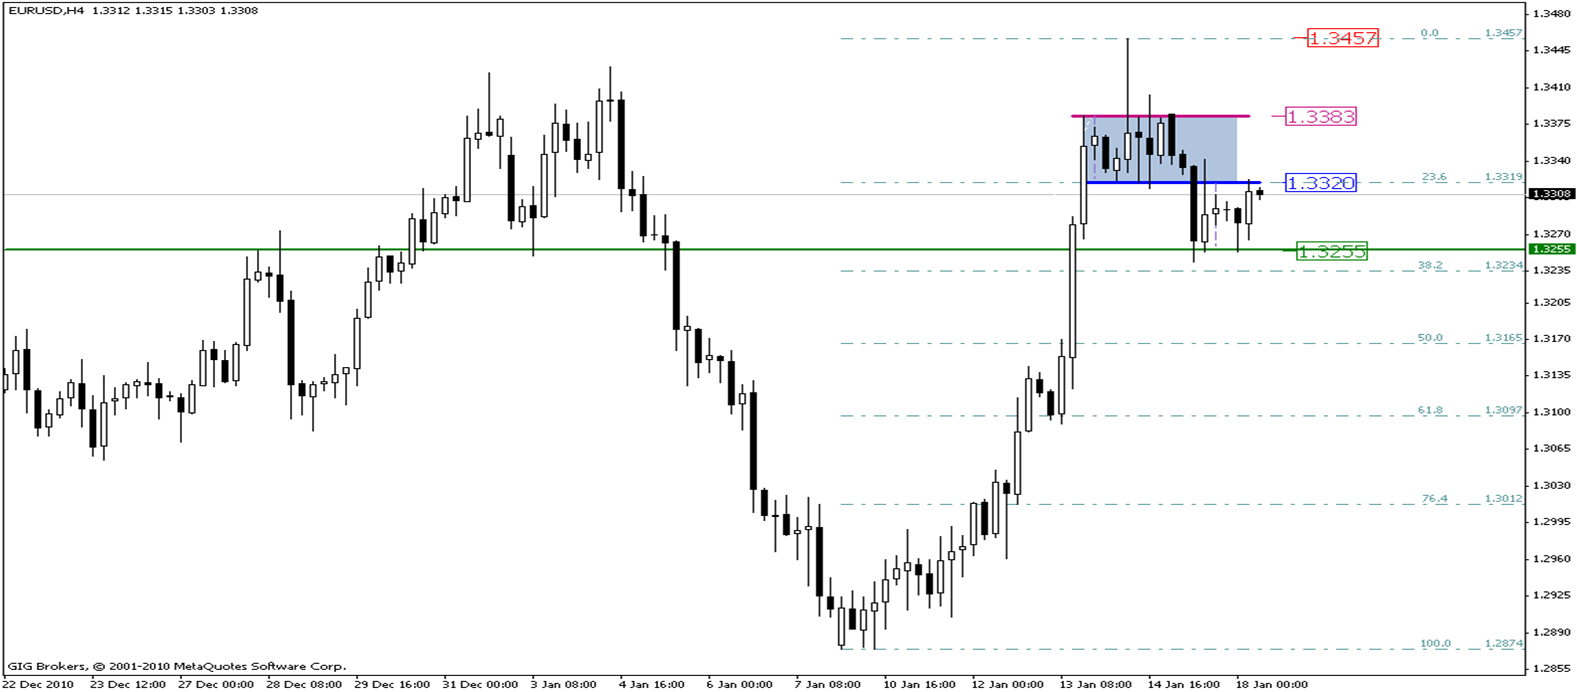
last week trades saw a new rising for the European currency against the U.S dollar where the pair registered the highest price of these trades at the level 1.3457 and despite of this rising, the pair did not achieved a good close above the resistance level 1.3383 where the pair was pushed declining to re-test the support level 1.3320. The last week trades were consolidating between the resistance level 1.3383 and the support level 1.3320 and this week trades are also confined between these levels which represent the rectangle harmonic pattern, the resistance level 1.3383 performs as the top boarder and the support level 1.3320 performs as the bottom boarder, so it is expected with breaking any boarder of this harmonic pattern, the pair will continue the new direction and this means that if the pair broke the top boarder of this harmonic pattern, it will rise till reaching the targeted area between the levels 1.3446 and 1.3457. but if the pair broke the bottom boarder of this harmonic pattern, it will decline till reaching the targeted area between the levels 1.3255 and 1.3234 which represents 38.2% Fibonacci correction level for the bearish direction (from 1.2874 to 1.3457).
Res. 1.3450 1.3525 1.3593
Pivot 1.3382
Sup. 1.3307 1.3239 1.3164
GBPUSD
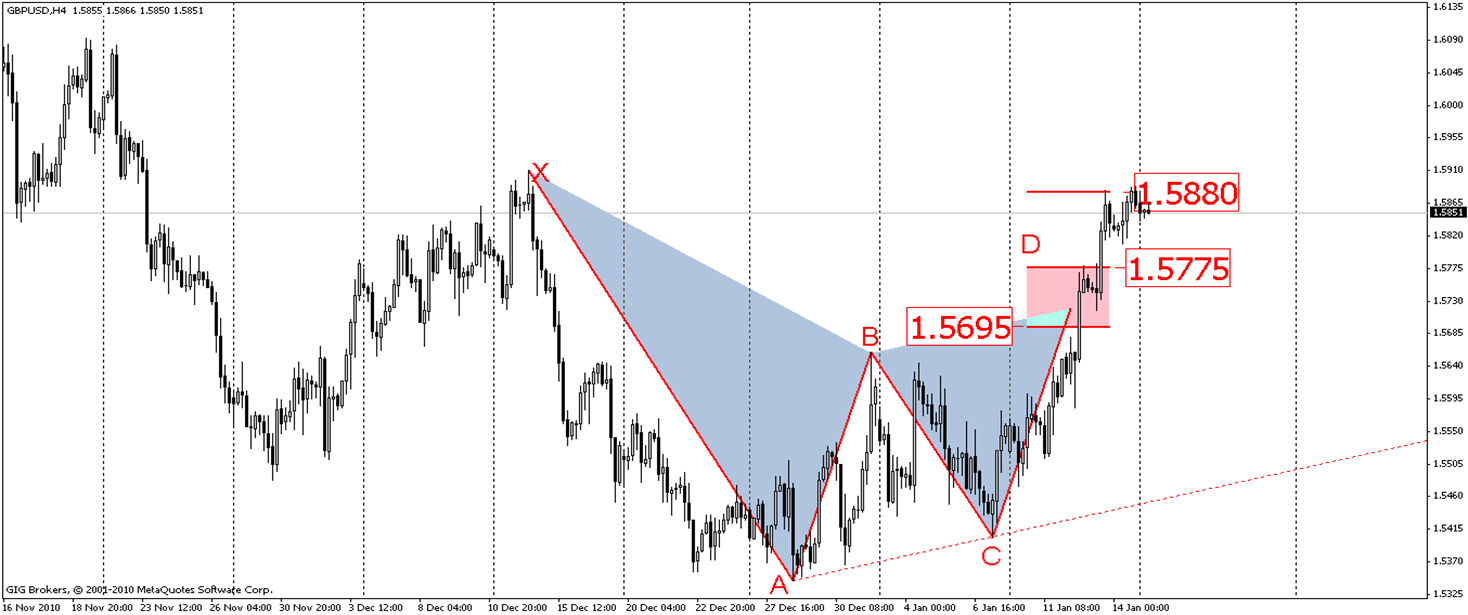
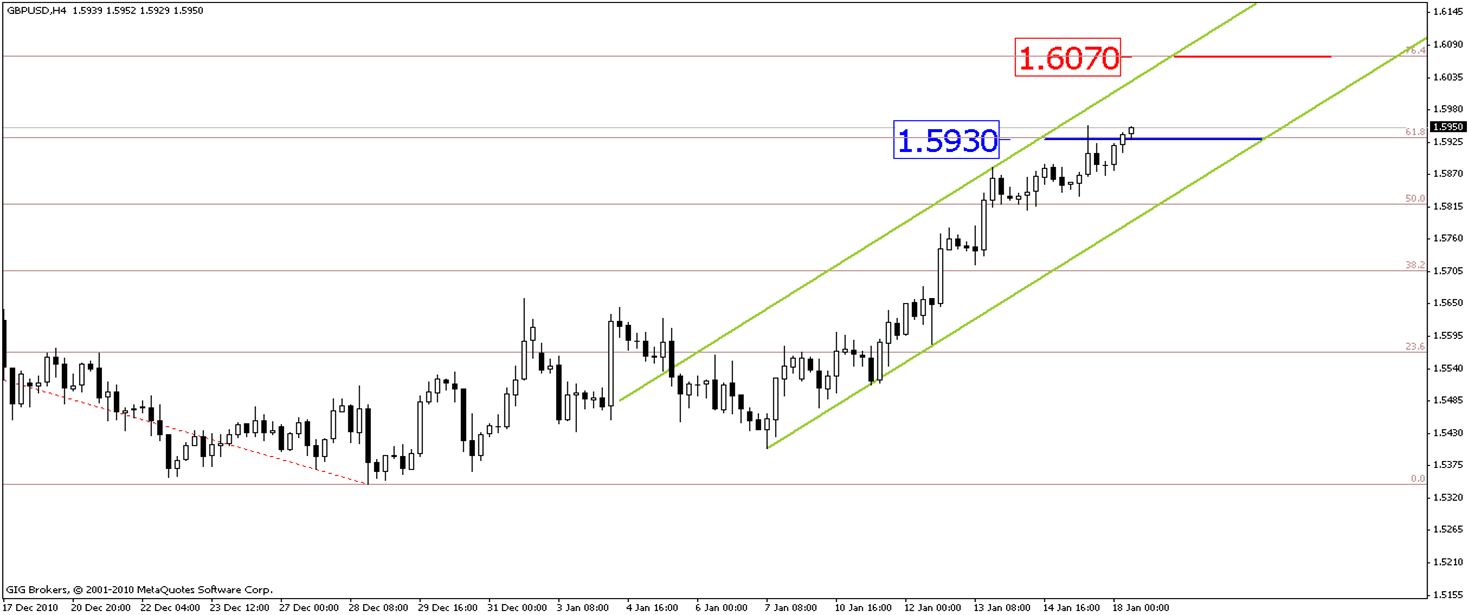
As it was expected previously, the pair succeeded to rise during last week trades whereas, the pair broke the resistance level 1.5775 and reached the resistance level 1.5880 and it is noticed that this level is holding against the pair testing expecting a corrective reflection to the pair during the upcoming intraday levels, targeting to re-test the broken price during the last week trades at the level 1.5775 as a support bottom that the pair will use to collect the needed momentum in order to continue rising.
It is important to mention that the inability of the level 1.5775 to hold against the pair re-testing will push the pair to reach the support level 1.5695 during today's trades.
The stability of these expectations requires the stability of the resistance level 1.5880.
RES. 1.5897 1.5932 1.5976
Pivot 1.5854
Sup. 1.5818 1.5778 1.5793
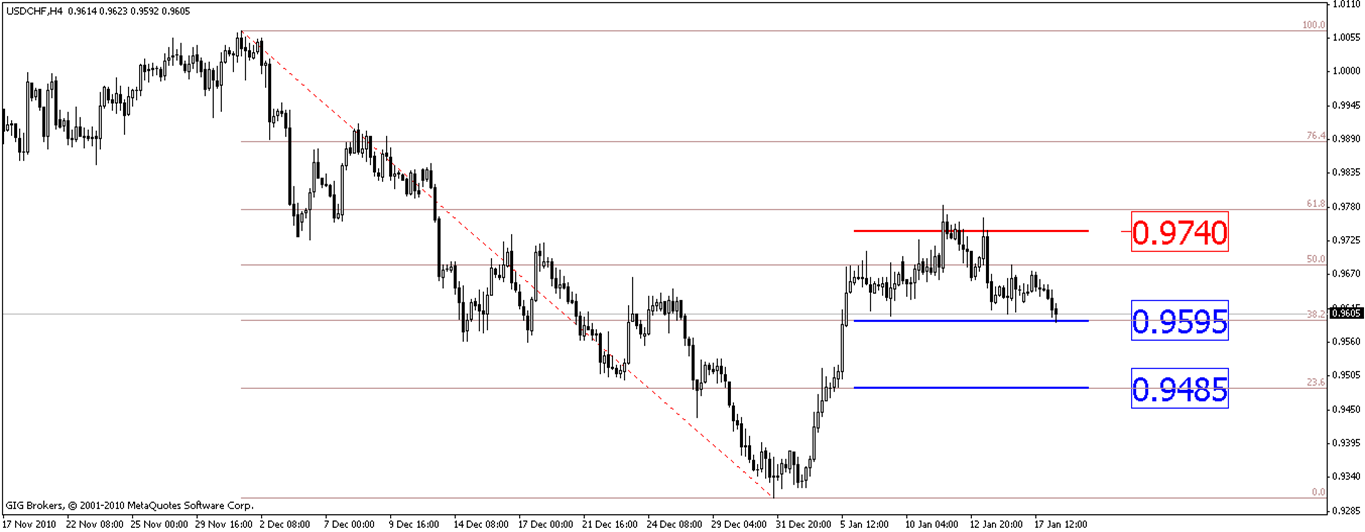
USDCHF
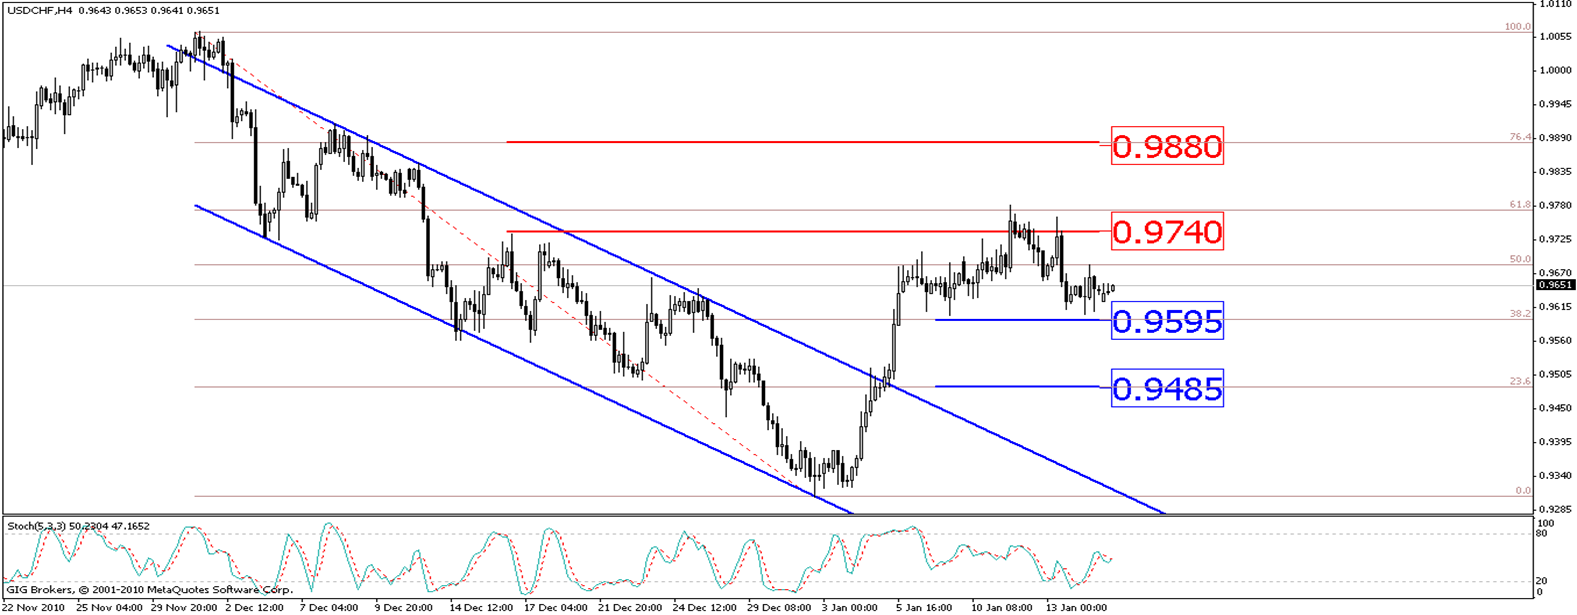
The resistance level 0.9740 succeeded to hold against the pair testing for the second straight time, this was on the contrary of the expectations that referred to more rising in order to shift the direction of the pair to the possibility of continuing the bearish direction during today's intraday levels to led the expectation of reaching the pair to test the support level 0.9595 which represents 38.2% Fibonacci correction level for the last long-term bearish wave, this level is an important one because of determining the direction of the pair during today's intraday trades so that, if the pair succeeded to break this level, it will target the support level 0.9485 so the bearish direction will be confirmed during the intraday levels and the short-term.
The stability of these expectations requires the stability of the resistance level0.9740.
RES. 0.9685 0.9724 0.9766
Pivot 0.9645
Sup. 0.9607 0.9564 0.9520
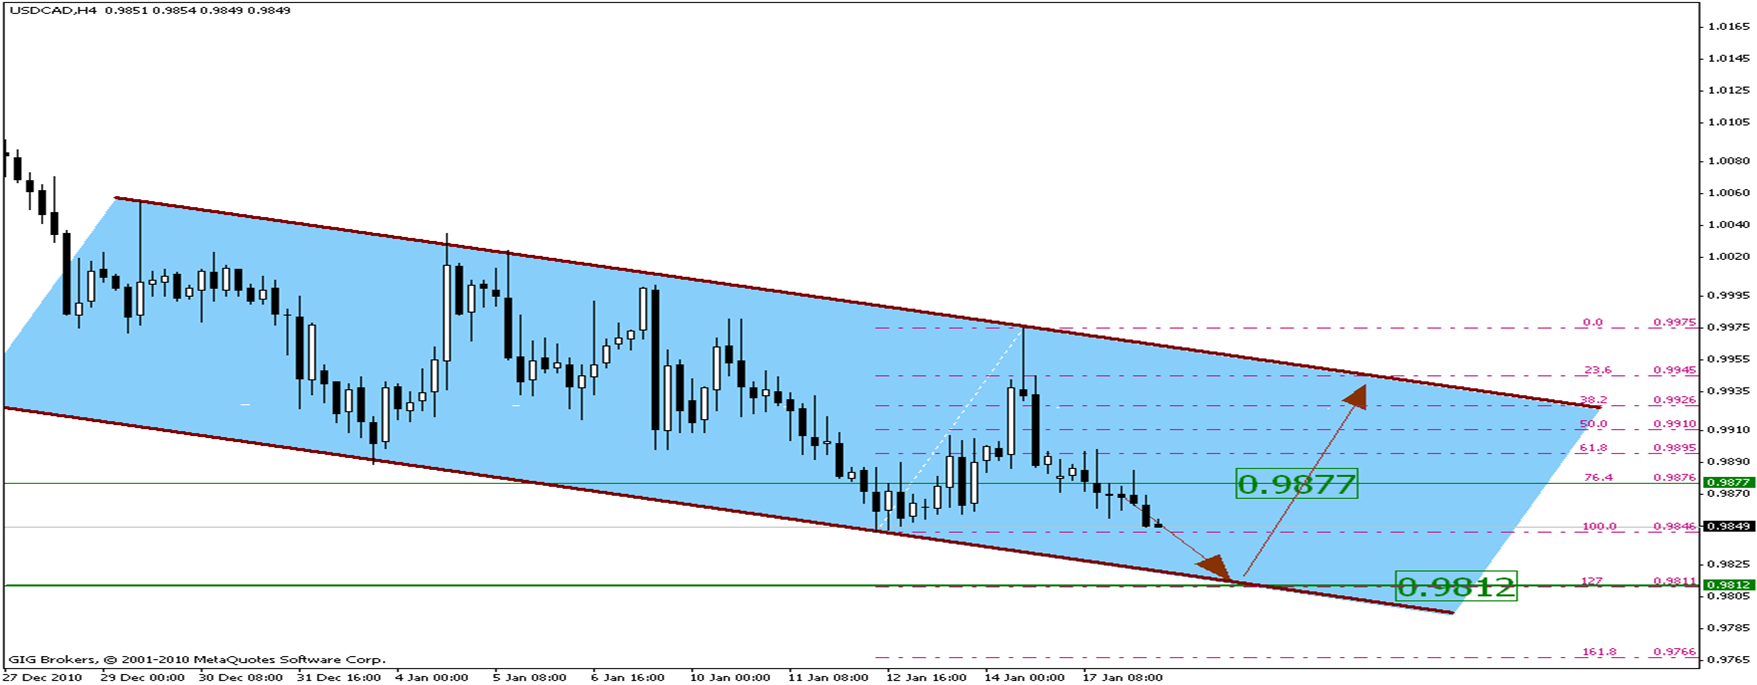
USDCAD
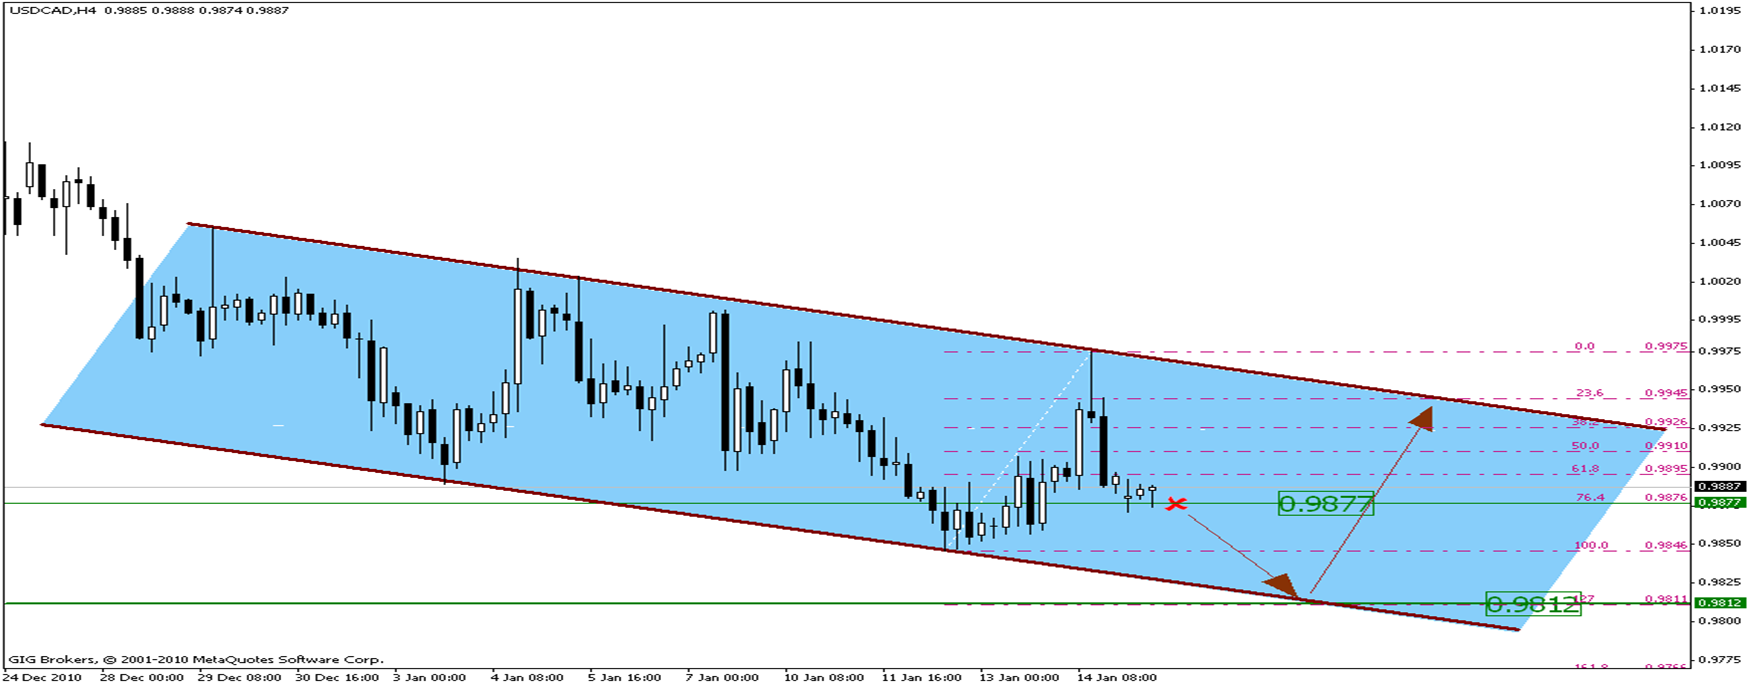
As mentioned in the chart; it's noticed that the pair is taking from the bearish direction for the medium and the short-terms a main sign for it, and this bearish direction is embodied through the movement inside the bearish channel, whereas the pair has formed a bearish top at the resistance level 0.9975 which coincides with the top boarder for the channel, the pair was pushed down from this top to retest the nearest support levels, whereas the intraday trades are around the support level 0.9877 which represents 76.4% Fibonacci retracement correction level for the bullish direction ( from 0.9846 to 0.9975). if the pair formed a new bottom at this level, the pair will continue rising again to retest the nearest resistance levels with testing the top boarder for the bearish channel which with breaking it up means a beginning of a correction bullish direction for a short-term, but in case of breaking the support level 0.9877 down means a further drop searching to form a new bearish bottom which is expected to be at the level 0.9812 which represents 127% Fibonacci retracement continuous level for the same bullish direction.
To reach this level, the support level 0.9846 must be broken.
Res. 0.9951 1.0009 1.0043
Pivot 0.9917
Sup. 0.9859 0.9825 0.9767
AUDUSD
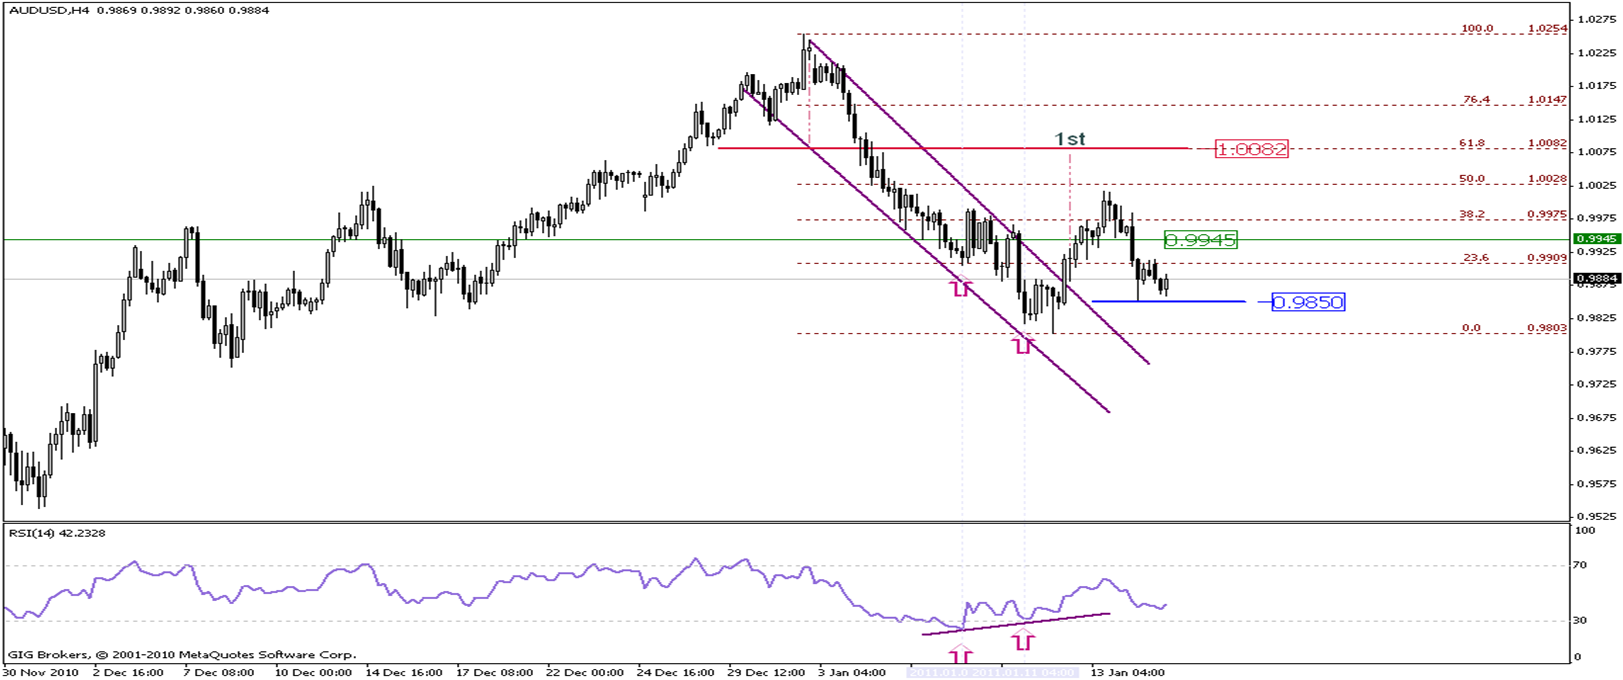
The support level 0.9945 didn't succeed on stopping the bearish move which has began from the level 1.0018 and is nearly located at 50% Fibonacci retracement correction level for the bearish direction (from 1.0254 to 0.9803) and this bearish move was continued during last week trades until the pair found a good support level at 0.9850 where a new bottom were formed at it which the pair is still trading above. with the beginning of this week trades, if the pair didn't succeed on breaking this level down means a further drop till the next support level at 0.9803 which represents a major support level to the pair for the medium and the short-terms, if the pair keeps trading above this level means that the pair will return again to rise retesting the nearest resistance levels, but with breaking this level, it means that the bearish direction for the medium-term are continuing towards the support level 0.9740.
Res. 0.9972 1.0055 1.0115
Pivot 0.9912
Sup. 0.9831 0.9778 0.9688
Clients of GIGFX who has a real account can be able to see FULL Version for all 16 Currencies in member area section.
To know more about our 25$ Bonus AccountPromotion, please visit:
Tuesday 18-01-2011 Technical Analysis Report
EURUSD
Yesterday trades saw declining the European currency against the U.S dollar, this declining came to correct the last bullish wave of the euro, it is noticed through this declining that the pair broke down the bottom boarder of the rectangle pattern that has been referred to it through yesterday report to continue declining, achieving the target of the rectangle pattern by reaching the support area between the levels 1.3255 and 1.3234 that represents 38.2% Fibonacci correction level for the bullish direction (from 1.2874 to 1.3457), the pair formed a consecutive bottoms at the mentioned area with a strong signal that the short-term correction is finished at these levels. It is noticed through the Asian period trades that the pair returned rising to re-test the bottom boarder of the rectangle pattern at the resistance level 1.3320 and if the pair broke this level up during the upcoming trades, it will continue rising, targeting the level 1.3383 which with its breaking up the pair will rise targeting to re-test the resistance level 1.3457.
The stability of these expectations requires the stability of the support level 1.3234.
Res. 1.3370 1.3445 1.3513
Pivot 1.3302
Sup. 1.3230 1.3166 1.3089
GBPUSD
Yesterday trades saw declining the European currency against the U.S dollar, this declining came to correct the last bullish wave of the euro, it is noticed through this declining that the pair broke down the bottom boarder of the rectangle pattern that has been referred to it through yesterday report to continue declining, achieving the target of the rectangle pattern by reaching the support area between the levels 1.3255 and 1.3234 that represents 38.2% Fibonacci correction level for the bullish direction (from 1.2874 to 1.3457), the pair formed a consecutive bottoms at the mentioned area with a strong signal that the short-term correction is finished at these levels. It is noticed through the Asian period trades that the pair returned rising to re-test the bottom boarder of the rectangle pattern at the resistance level 1.3320 and if the pair broke this level up during the upcoming trades, it will continue rising, targeting the level 1.3383 which with its breaking up the pair will rise targeting to re-test the resistance level 1.3457.
The stability of these expectations requires the stability of the support level 1.3234.
RES. 1.5948 1.6010 1.6067
Pivot 1.5891
Sup. 1.5829 1.5772 1.5710
USDCHF
The resistance level 0.9740 succeeded to hold against the pair testing for the second straight time, this was on the contrary of the expectations that referred to more rising in order to shift the direction of the pair to the possibility of continuing the bearish direction during today's intraday levels to led the expectation of reaching the pair to test the support level 0.9595 which represents 38.2% Fibonacci correction level for the last long-term bearish wave, this level is an important one because of determining the direction of the pair during today's intraday trades so that, if the pair succeeded to break this level, it will target the support level 0.9485 so the bearish direction will be confirmed during the intraday levels and the short-term.
The stability of these expectations requires the stability of the resistance level 0.9740.
The previous analysis is still remaining
RES. 0.9672 0.9698 0.9722
Pivot 0.9648
Sup. 0.9622 0.9598 0.9572
USDCAD
The pair has succeeded yesterday on breaking the support level 0.9877 to continue falling, keeping forming the directions for the medium and the short-terms which embodied through the movement inside the bearish channel, expecting that the yesterday scenario will be continued till reaching the pair the level 0.9812 which represents 127% Fibonacci retracement continuous level for the bullish direction ( from 0.9847 to 0.9975 ). Reaching this level, the support level 0.9847 must be broken. It is expected that the price will coincide by reaching the support level 0.9812 with the bottom boarder for the bearish channel expecting to form a bearish bottom which the pair will use to rise again to retest the nearest resistance levels.
Res. 0.9892 0.9916 0.9935
Pivot 0.9873
Sup. 0.9849 0.9835 0.9806
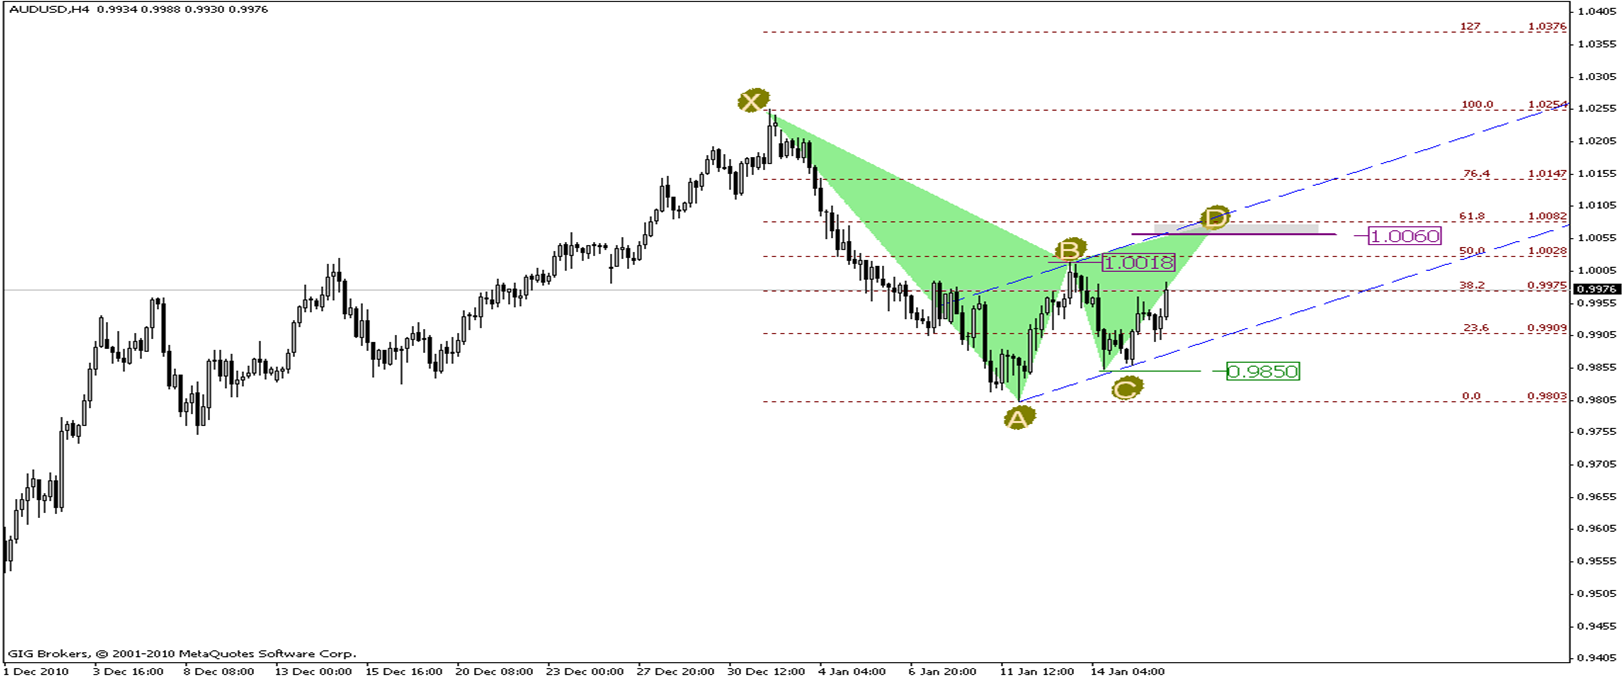
AUDUSD
As noticed in the chart; the pair is in process of forming a harmonic pattern ( Gartley ) in which the AB rib has came by 50% Fibonacci retracement correction level for the XA rib and the BC rib which represents 76.4% Fibonacci retracement correction level for the AB rib, so it is expected that the pattern will be completed at the D point which is located at the confined area between the level 1.0060 which represents 127% Fibonacci retracement correction level for the BC rib and the level 1.0082 which represents 61.8% Fibonacci retracement correction level for the XA rib therefore with continuing the pair rising during the next trades and breaking the resistance level 1.0018 which represents the B point, the pair will continue rising to form the CD rib which is expected to be completed at the mentioned area.
This expectation depends on the stability of the support level 0.9850.
Res. 0.9980 1.0025 1.0085
Pivot 0.9920
Sup. 0.9875 0.9815 0.9770
Clients of GIGFX who has a real account can be able to see FULL Version for all 16 Currencies in member area section.
To know more about our 25$ Bonus Account Promotion, please visit:
- Free trading apps
- Over 8,000 signals for copying
- Economic news for exploring financial markets
You agree to website policy and terms of use
EURUSD
For the 1ST time the EURO pass the 1.4100 level for about nine months, where the pair achieved 1.4122 to form a top at this level which pushed the pair down in order to correct the last bullish move and also to retest the neck line for the inverted head and shoulder pattern, that locates in between 1.4010 and 1.4027.
The pair formed a bottom at this area which pushed up the pair to retest 1.4122 level; if the pair was able to break this level then it will continue rising and it may reach 1.4250 that represents the target for the inverted head and shoulder pattern.
This expectation depends on the stability of the support level 1.4010.