Looks promising
I'll try it
Thank you!
Alexey
Looks promising
I'll try it
Thank you!
AlexeyHell Yeah!
This is 2day 

And, a banker moneymanagement file. that will show u if you have just 3000$ and if you make 25 pips a day on this method.
Best of luck friends and dont forget me if u make success.
this file shows if you have 3000$ u can make around 5million $ in 180 days and with just 20-25 pips target.
Its the compounding effect that'll make u rich.
Good luck guys and gals 
Thx for the system, il will look and test accuracy, we could developpe about it later.
Take care!
Looks good. Thank You.
How ong have you been using this systemm for?
hi...
sometime ago in this forum any breakout strategy that used Asian High and Asian Low to breakout GBPUSD.
i hope this tool can help to backtest the strategy. u just need input what gmt_shift of your broker, and how many day you wanna to backtest.
sometime ago in this forum any breakout strategy that used Asian High and Asian Low to breakout GBPUSD. i hope this tool can help to backtest the strategy. u just need input what gmt_shift of your broker, and how many day you wanna to backtest.
Hi,
Thanks for this indicator, its works well on my broker with timeshift set at 0.
This is great, don't need to draw the lines, its doing it automatically for me.
Thanks a lot!
hi, pls check my time ..
You need to pull out a 15 minute chart , nots the 1hour.
Hi , this is my chart on Interbankfx 15 m. , ibfx chart is gmt.
I putted the lines , are correct ? i have a doubt
I tried the idicator psted but i have different values ,may be i am doing something wrong because the levels shouwed are different
Thanks
- Free trading apps
- Over 8,000 signals for copying
- Economic news for exploring financial markets
You agree to website policy and terms of use
Hi,
Everyones sharing such a lot on Forex-TSD, I thought i will take the time to share with all too what i have learnt that works.
I just got this idea from a friend, who gets this idea from another.
We called it the Big Dog 1400-1600 USD Breakout Strategy. (Around US OPEN)
Its a simple strategy. You need not have any indicator, just the default ones found in your metatrader.
Daily Profit Potentials: Around 30-50pips +
All you need to do is the following:-
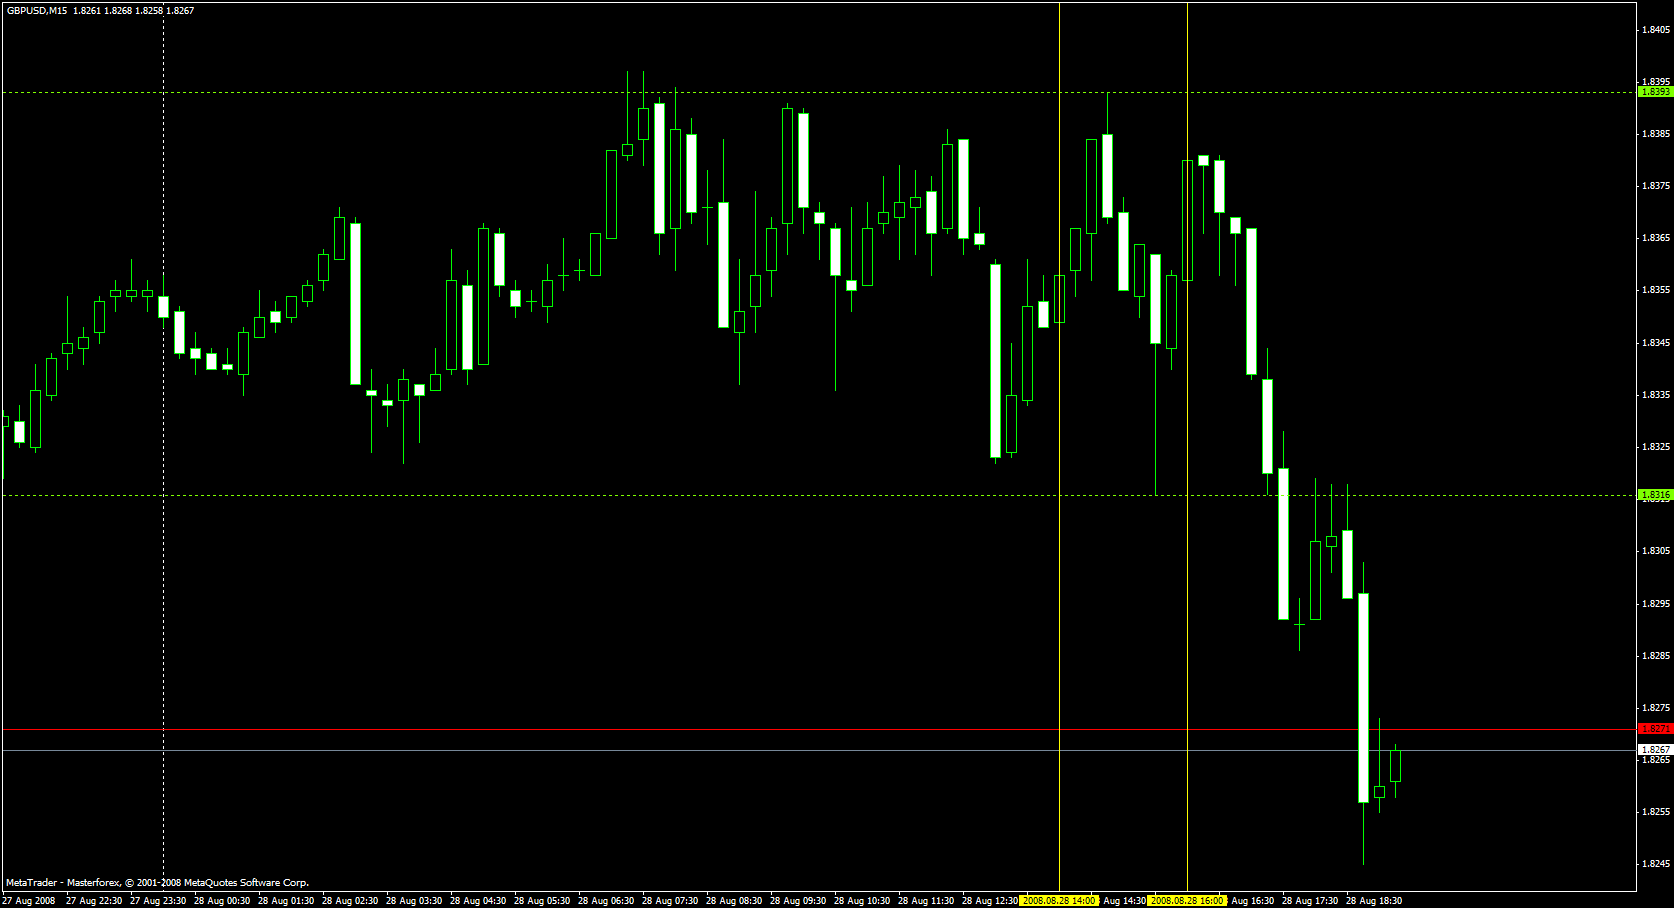
1. Pull out a M15 Chart for a USD Major pair, example like GBPUSD.
2. Draw a vertical line at 14:00 time on your Chart.
3. Draw a vertical line at 16:00 time on your Chart.
4. Draw a Horizontal line at the high of candles/bars in between the vertical
line.
5. Draw a Horizontal line at the Low of candles/bars in between the vertical
line.
Thats it, Simply put a buy stop at the high and sell stop at the low with stoploss at the low (If your buying) and stoploss at the high (If your selling).
Ideal Targets: Around 30-50pips or no targets if you think it can go more
Trailing Stop of 15pips, if your using metatrader.
Example screen.
You can also check historical records and see its very profitable!!
Some points to note:
1. There are only 9 candles/bars in the 15 minute chart, between 1400-1600.
2. If the Distance between the high and low is less than 50-60 pips, it could be very profitable.
3. If the Distance between the high and low is more than 50-60 pips, it could be not very profitable.
4. If the price doesn't break the high/low, its a ranging market.
5. The USD news are usually released around or after the 14:00-16:00 GMT phase.
6. The signals are only valid for the current day, Next day u again need to wait for the 1400-1600 time and 9 candles again.
*THE TIMEZONE IS BETWEEN 7AM-9AM New york Time*
#Custom Indicator# Thanks to Andee
ant-gu_breakout.ex4
input what gmt_shift of your broker
Mulai = start,
Akhir = end,
Jumlah_Hari = number of day you want to display the indicator.
Thats all about this system and good luck to everyone.