The author's strategy of Alexander Elder, a former Russian emigrant who left medical practice in psychiatry for a career as a trader.
Possessing the talent of a writer (he went from a journalist to an editor of a specialized exchange magazine), in his writings the author showed the dependence of price movement on the “mood of the crowd”. On this basis, Elder developed a number of indicators and trading systems, with the help of which he proposed to “guess” the desires of the bulk of traders, determining where you can follow the crowd and where the crowd is wrong. A description of the indicators can be found by reading the author's books, there are Russian-language publications, the indicators themselves are included in the basic package of many trading platforms, for example, Metatrader .
Developed and described by Elder in his bestseller titled in the Russian version - "How to play and win on the stock exchange."
The essence of the strategy is simple, every trader knows about the benefits of trading with the trend . The author of the strategy proposes to confirm the found trend trend on all timeframes: short-term , long-term and medium-term . It is believed that the signals that have passed the triple selection have the highest chance of being profitable.
Tactics
The working timeframe (the timeframe on which the trader performs the main work) is defined as medium-term. We display additional chart windows an order of magnitude higher than the working one and an order of magnitude lower. That is, for a four-hour chart, such timeframes can be daily and hourly.
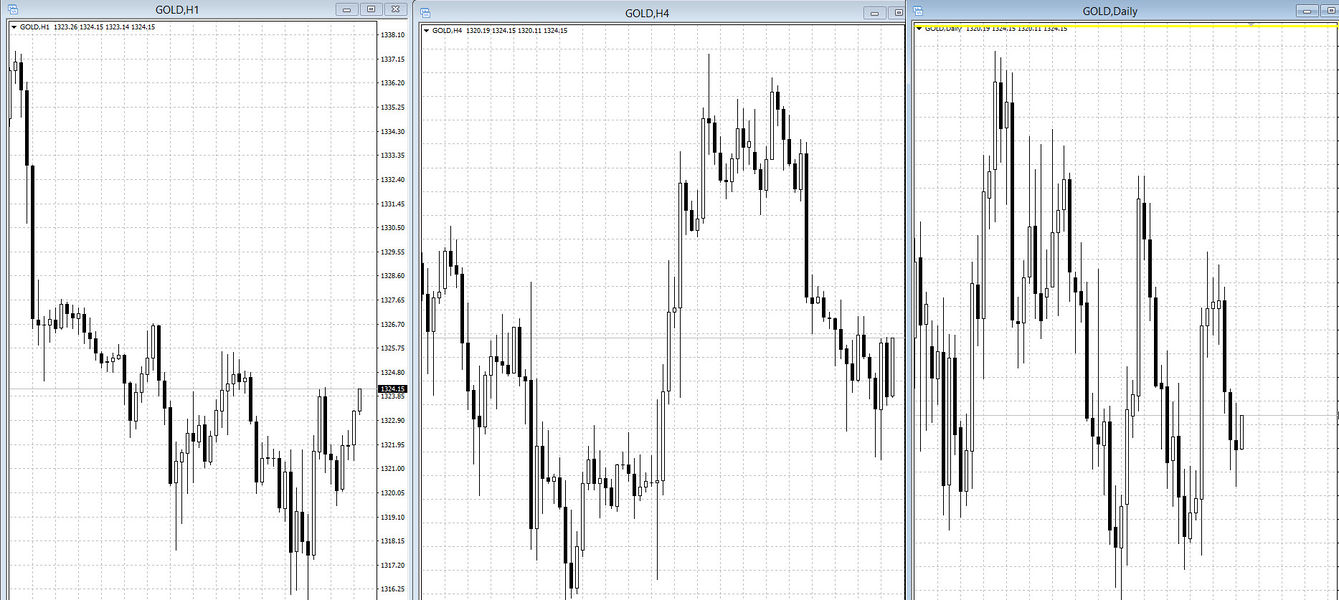
In fact, choosing the scale of the trading range is a problem. Because the question arises, what is the optimal distance between the three screens? When answering this question, it should be taken into account that the postulates of the market say that the accuracy of the signal depends on the size of the analyzed time interval, the higher, the more accurate.
To decide on the choice of "distance" between the three screens, a simple reduction of market fluctuations to calendar factors using a coefficient calculated by Alexander Edler will help. Having determined that a week relates to a daily candle as 1 to 5 (working five days), a month can be represented to a week as 1 to 4, 5, etc., the author on the pages of his works suggested choosing time intervals by multiplying (dividing) the starting timeframe by a factor of 5. Thus, being a scalper , if you are going to trade on five-minute periods, choose a short-term range - 1 minute, long-term - 30 minutes (we use rounding up to the size of standard timeframes).
How to determine the trend at these intervals, how to find out the state of the market and the direction of the trend? The market does not give exact answers, being a set of probabilities and opportunities determined by technical analysis indicators. The creator of the three-screen system determines the state of the market through the combined use of trend indicators and oscillators. The Adler trend looks like this: in an uptrend, trend indicators are rising, oscillators indicate overbought , in a downtrend, trend indicators are falling and oscillators indicate oversold .
On a long-term chart, the trend is usually pronounced, there are no market noises, the analysis starts from this chart, and then descending.
MACD will best cope with the task of determining the trend in the long term, in this analysis a modified theory of analysis is used, we determine the slope of the straight line drawn along the tops of the last two bars of the histogram, the direction of the slope will indicate the trend, the angle - strength.
Alexander Elder's First Screen
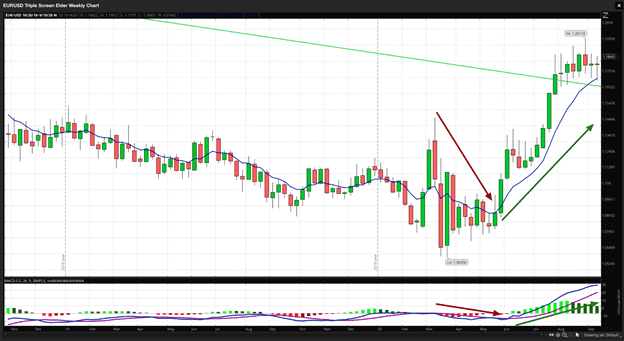
Let us use a triple screen in Forex trading with the EUR/USD currency pair as an example. This is the screen used to identify the dominant trend in the asset and to decide in which direction we will make the trade.
First, watch the chart. If the EUR/USD is trending up, we will identify buying opportunities; on the other hand, if trending down, we would seek to sell the EUR/USD.
For this, we will use a weekly chart with two trend indicators, an Exponential Moving Average (EMA) with 13 periods, and a Moving Average Convergence Divergence indicator (MACD) with 12,26,9 settings.
The next step is to try to identify MACD movements away from the zero area. If the MACD is moving upward after crossing the zero area, it will be an uptrend. If MACD is crossing down from the area above zero, it will be a downtrend. The EMA will confirm the direction of the tide too.
Elder's Second Screen
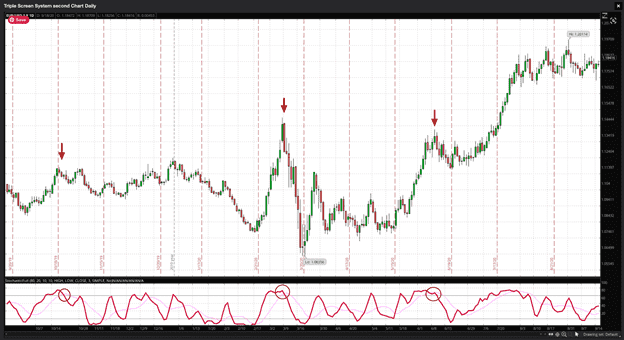
Once we have identified the trend's direction, we then switch to watching the second screen. This chart will help us identify the short-term situation and know when the dominant trend is ready to resume its run after a pause.
The first step is to identify short term reversals that are exhausted or finished. It would be a contrarian movement from the long-term trend or a smaller trend that goes in the opposite direction of the dominant one.
For this purpose, we will use the stochastic oscillator. Dr. Elder also recommends the Relative Strength Index (RSI) and William %R. You can choose your favorite one.
The second step is to identify the break. This signal will appear when the stochastic leaves the overbought or oversold areas and returns to more median values in the center of its range.
When reading stochastics, we follow the K line and the D line. The K line is faster than the D line. You should identify when the D line moves into overbought, over the 80 line, or oversold, under the 20 line.
The trigger would occur when the D line enters overbought or oversold conditions; it will show us a direction change. Your confirmation will be at the moment the D line crosses the K line.
Finally, you would go short when the stochastic is returning from overbought conditions. On the other hand, you would buy the asset when the indicator is returning from an oversold area.
Now, you have a dominant trend identified and have identified the exhaustion of a reversal against that — the time has arrived to try to determine a precise entry point.
Elder's Third Screen
After identifying the dominant trend in the first screen, and getting a signal from the second screen, we move to the third screen. It will provide us with precise entry points.
In the third screen, you should ideally look for breakouts in the direction of the dominant trend. Elder uses a technique of trailing stops to determine specific entry points.
For example, if we are looking for bullish entry points in a daily chart used as our intermediate screen, we would use a trailing buy stop one point above the previous day's high.
On the other hand, if we are looking for a selling entry point, we will use a trailing sell stop one point below the previous day's low.
The theory says that if the market retakes its uptrend and hits your stop, your long position will be activated. However, if the market goes against you, then your stop will be deactivated.
In that case, you can trail your stop and set a new one by dropping it to one point above the maximum of the day that has just passed. According to Elder’s rules, you may keep trailing it until activated or until you decide to avoid the trade if you see the weekly trend has changed its direction.
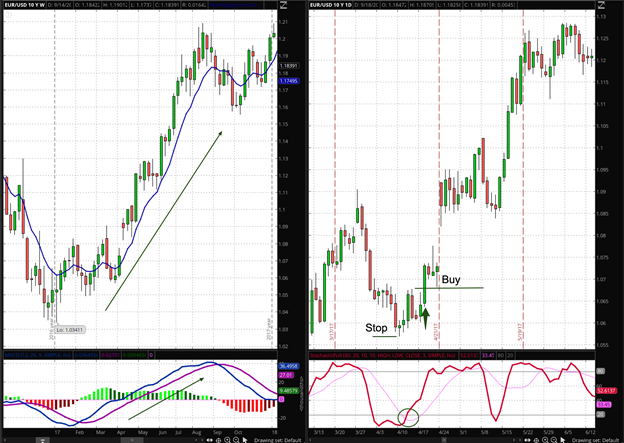
On the other hand, if we identified a dominant downtrend and watched a mid-term uptrend, the sell order will be placed one point below the low of the previous period from which the oscillator activated the signal. The stop-loss is then placed behind the two-day high price.
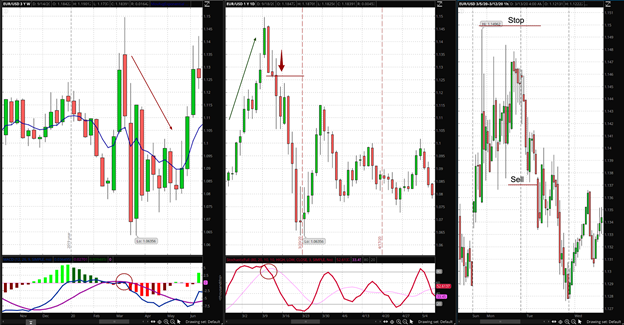
Finally, the moment to take profits will be determined by your trailing stop once you are in a position. You can set it to protect 50 percent of your running profits or, in the case of shorter time frames, a fixed pip value should work just as well.
Another way to determine your profit taking level is to watch for oversold levels when you are short, and overbought levels when you are long and, therefore, when the oscillator begins to return to a normal level, exit the trade manually.
According to Dr. Elder, the third screen does not need a separate chart or an additional indicator. You can trade the Elder triple screen strategy with only two screens, after all!
Automate your trading with our Robots and Utilities
EA Long Term MT4 https://www.mql5.com/en/market/product/92865
EA Long Term Mt5 https://www.mql5.com/en/market/product/92877
Scalper ICE CUBE MT4 - https://www.mql5.com/en/market/product/77108
Scalper ICE CUBE MT5 - https://www.mql5.com/en/market/product/77697
Utility ⚒
EasyTradePad MT4 - https://www.mql5.com/en/market/product/72256
EasyTradePad MT5 - https://www.mql5.com/en/market/product/72454
Risk manager MT4 - https://www.mql5.com/en/market/product/72214
Risk manager MT5 - https://www.mql5.com/en/market/product/72414
Indicators 📈
3 in 1 Indicator iPump MT4 - https://www.mql5.com/en/market/product/72257
3 in 1 Indicator iPump MT5 - https://www.mql5.com/en/market/product/72442
Power Reserve MT4- https://www.mql5.com/en/market/product/72392
Power Reserve MT5 - https://www.mql5.com/en/market/product/72410


