How Do I Use Stochastic Oscillator to Create a Forex Trading Strategy?
The stochastic oscillator is a momentum indicator that is widely used in forex trading to pinpoint potential trend reversals. This indicator measures momentum by comparing closing price to the trading range over a given period.
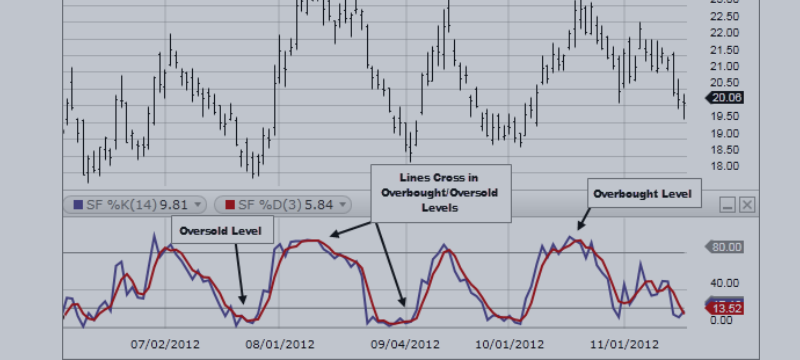
The charted stochastic oscillator actually consists of two lines: the indicator itself is represented by %K, and a signal line reflecting the three-day simple moving average (SMA) of %K, which is called %D. When these two lines intersect, it signals that a trend shift may be approaching.
In a chart displaying a pronounced bullish trend, for example, a downward cross through the signal line indicates that the most recent closing price is closer to the lowest low of the look-back period than it has been in the previous three sessions. After sustained upward price action, a sudden drop to the lower end of the trading range may signify that bulls are losing steam.
Like other range-bound momentum oscillators, such as the relative strength index (RSI) and Williams %R, the stochastic oscillator is also useful for determining overbought or oversold conditions. Ranging from 0 to 100, the stochastic oscillator reflects overbought conditions with readings over 80 and oversold conditions with readings under 20. Crossovers that occur in these outer ranges are considered particularly strong signals. Many traders ignore crossover signals that do not occur at these extremes.
When creating a trading strategy based on the stochastic oscillator in the forex market, look for a currency pair that displays a pronounced and lengthy bullish trend. The ideal currency pair has already spent some time in overbought territory, with price nearing a previous area of resistance. Look for waning volume as an additional indicator of bullish exhaustion.
Once the stochastic oscillator crosses down through the signal line, watch for price to follow suit. Though these combined signals are a strong indicator of impending reversal, wait for price to confirm the downturn before entry—momentum oscillators are known to throw false signals from time to time.
Combining this setup with candlestick charting techniques can further enhance your strategy and provide clear entry and exit signals.
Automate your trading with our Robots and Utilities
EA Long Term MT4 https://www.mql5.com/en/market/product/92865
EA Long Term Mt5 https://www.mql5.com/en/market/product/92877
Scalper ICE CUBE MT4 - https://www.mql5.com/en/market/product/77108
Scalper ICE CUBE MT5 - https://www.mql5.com/en/market/product/77697
Utility ⚒
EasyTradePad MT4 - https://www.mql5.com/en/market/product/72256
EasyTradePad MT5 - https://www.mql5.com/en/market/product/72454
Risk manager MT4 - https://www.mql5.com/en/market/product/72214
Risk manager MT5 - https://www.mql5.com/en/market/product/72414
Indicators 📈
3 in 1 Indicator iPump MT4 - https://www.mql5.com/en/market/product/72257
3 in 1 Indicator iPump MT5 - https://www.mql5.com/en/market/product/72442
Power Reserve MT4- https://www.mql5.com/en/market/product/72392
Power Reserve MT5 - https://www.mql5.com/en/market/product/72410


