Chandelier Exit Strategy - A VOLATILITY based Indicator that avoid early exits and maximize returns
Introduction
When in a trade, the most important strategy a trader must implement is powerful and successful EXIT STRATEGY. As we all know, sometimes how we exit is more important than the entry. Traders can tend to hold positions too long and after a healthy profit they find themselves in deep drawdown. Why? Well, other than not having good trading psychology, the reason is because the trader has no indication when enough drawdown is enough or enough profit is enough. The challenge every trader must face is determining when to exit a profitable or losing trade. The trader may ask the following questions:
- How long should I hold my position?
- When should I exit the positionwhen in profit?
- When should I close a losing trade?
In many cases a trader does not have a clear exit strategy for profitable positions and for losing positions. In addition, the trader does not always have a set take profit or stop loss level in mind. This tends to lead to exiting the trade too soon or holding the trade too long. This is by far one of the biggest challenges every unprofitable trader has to face every time they enter the market. The Chandelier Indicator can help eliminate this challenge by adapting a clear set of rules when using this powerful tool.
The Chandelier Indicator
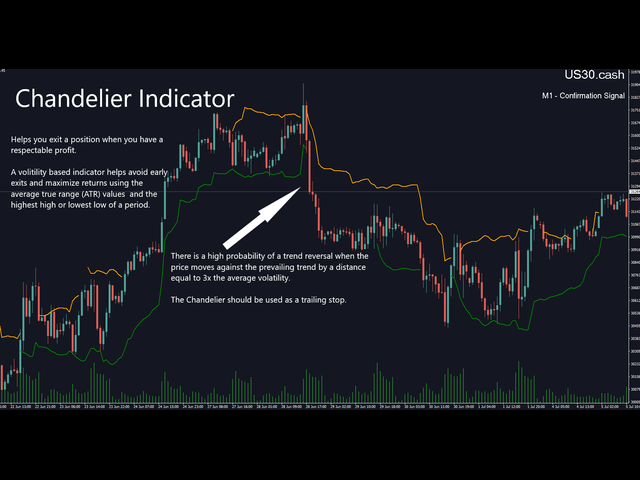
The Chandelier Indicator can be used as a powerful exit strategy as it can help you exit a position when a respectable profit was earned. The Chandelier Indicator uses a volatility calculation and helps avoid early exits due to small opposite trend impulses. This is due to it's volatility calculation that uses a combination of the Average True Range (ATR) and the Highest High or Lowest Low of a set period. The Indicator calculates volatility and hangs below the Highest High of the calculated period, hence the name Chandelier. The Chandelier Exit strategy was developed by Chuck Le Beau, a recognized expert in exit strategies. This indicator is designed to keep traders in the trend until a defined trend reversal happens.
What is the Average True Range?
According to this Investopedia.com article, titled Measure Volatility With Average True Range (investopedia.com), the range is the difference between the high and low prices on any given day (period). It reveals information about how volatile an instrument is. The ATR takes the true range for 22 periods, by default and gets the average range. This is the Average difference between the High price and Low Price for 22 periods. The higher the distance between the high and low prices the more volatility, the lower the average distance between the high and low prices the lower the volatility. This can indicate erratic price movement. It is a Simple Moving Average based on the True Range. Shorter time frames will show higher volatility or erratic price changes, whereas higher timeframes will have a slower and smoothed out SMA of True Range, also known as ATR or Average True Range.

How To Use the Chandelier Exit Indicator
The main objective of using the Chandelier Exit indicator is to signal the trader to a possible trend reversal after an extended trend. This allows the trader to exit positions near the end of the overall trend to get maximum returns on their investment. In high volatility markets, the trader will set a larger trailing stop outside of the Chandelier bands, in order to protect their position from being closed due to choppy market conditions.
- When in a sell position, close or reduce position size when price penetrates above the top Chandelier line.
- When in a buy position, close or reduce position size when price penetrates below the bottom Chandelier line.
How to Calculate the Chandelier Upper and Lower Bands.
- The Chandelier exit for a long position is equal to the 22 day High -ATR(22) X 3.
- The Chandelier exit for a short position is equal to the 22 day Low +ATR(22) X 3.
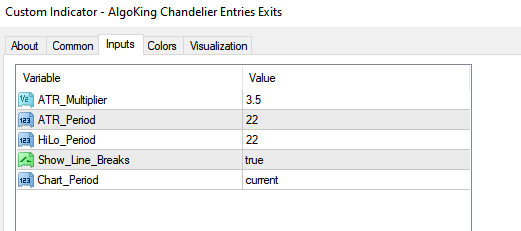
Certain instruments or markets move differently and may require for the ATR multiplier to be increased, in many cases the period for the Average Trading Range Multiplier may need to be between 3 and 5 to allow for more volatility. You can determine this if you see many false alarms that look like upper and lower band price breaks.
Comparing a Traditional Trailing Stop vs Chandelier Trailing Stop
When compared to a traditional TRAILING STOP, the trailing stop will only move in the direction of the position. In a buy position, the trailing stop will only move up and never move down. In a Sell position, the trailing stop will only move down and never up. A trailing stop will never consider market conditions or volatility. This makes your position vulnerable to having your stop loss triggered in a liquidity wick and then move deep into profit.
Whereas, the Chandelier will breathe with the market due to it's consideration for volatility that is accounted for in the calculation. A trailing stop that uses the Chandelier will move in the direction of the trade and also it will move in the opposite direction, depending on VOLATILITY. This add a level of protection to your stop loss because price needs to move (by default 3x) distance 3 times (by default) the average volatility. When price moves against the trend by a distance equal to 3 times the average volatility, a trend reversal is highly probable.
What is a Chandlier Uptrend
An uptrend occurs when the price of an instrument moves in an upward direction, making higher lows and higher highs and every peak is higher than the previous peak. Traders attempt take advantage of an uptrend by maximizing their profits before a trend reversal occurs. The Chandelier Exit is used to identify the uptrend and set a trailing stop level. When a possible trend reversal is identified, the trader will either reduce their position size or close the entire position. The upward trend is easily identified as price remains above the lower Chandelier band.
What is a Chandlier Downtrend
A downtrend can be defined as structure that is showing price is moving in a downward direction, making lower lows every valley is lower than the previous low. Traders attempt take advantage of a downtrend by maximizing their profits before a trend reversal occurs. The Chandelier Exit is used to identify the downtrend and set a trailing stop level. When a possible trend reversal is identified, the trader will either reduce their position size or close the entire position. The downward trend is easily identified as price remains below the upper Chandelier band. Additional indicators such as RSI can be used as additional confluence to build the case that the trend is near the end.
Conclusion
By far, the Chandelier Exit Strategy will allow the trader to be more confident when it is used as part of their exit strategy. Many professional traders recommend implementing the Chandelier Exit Strategy as a means to manage stop losses. It is not recommended to use the Chandelier Indicator to identify and generate entry signals because it is too prone to generating false signals.
Where to download the AlgoKing Chandelier Indicator
(Chandelier Indicator - https://www.mql5.com/en/market/product/83991)

About the Author
Leon (aka "Squawk") is the sole creator of the AlgoKing Lightning Bolt Strategy Expert Advisor (https://www.mql5.com/en/market/product/75170).
With over 25 years of Sr Software architecture and development experience, Squawk has already solved your trading problems before you were even introduced to him.
While working for Corporate America, Squawk found great success in the financial industry serving to design software tools for day traders and Hedge Funds. This experience has provided him with a rare insight of how Hedge Funds and other institutional investors maneuver money through the financial markets with great success.
Fast Forward to today, Squawk quit his 6-figure salary job and has become a successful full-time trader who fully relies on his creation, the Lightning Bolt Strategy, to continuously execute profitable trades. He and his trading community join together each day and trade LIVE on Zoom sessions that he hosts. Squawk genuinely wants you to have the same success and has provided a full forex-trading system to get you there.
About the Lightning Bolt Strategy and Expert Advisor.
The AlgoKing Lightning Bolt Strategy offers a wealth of rich features to help any trader, whether beginner or advance, secure profits
Built In Indicators
- Auto drawn Support and Resistance signals
- Auto drawn RSI Divergence signals
- Auto drawn Fibonacci Retracement signals with buy and sell entry lines.
- Lightning Bolt reversal signals.
- Auto drawn trend lines.
Trade Management
- Auto take partials at simple moving average targets.
- Auto take partial and stop losses at Fibonacci retracement levels. Draw the Fib retracement tool on the chart, double click it and apply Stop Loss and Take Partials.
- SHIFT-Click to create take partial and stop loss levels.
- Auto move stops to break even when first partial is processed.
- "Protect" button that moves stops to break even.
- "Take partial" button.
- Trailing stops.
- Custom take partial percentages for each take partial and stop loss line.
Benefits
- Join the AlgoKing Lightning Bolt Expert Advisor support group: https://www.mql5.com/en/messages/02E3BDCF0095D801
- Excellent for Day Trade / Swing Trades / Scalp setups
- Identifies high probability reversal trade setups using harmonics and price structure
- Works on all instruments
- Daily Signals: London and New York Session
- Used to pass FTMO and other PROP FIRM challenges, verifications and funded accounts.
- Live Zoom Calls.
- Full Chart Breakdowns and Analysis.
- Live Mentorship!
- Learn to Earn!
- With over 100+ members trading LIVE daily using the AlgoKing Lightning Bolt strategy.
- Check out our amazing Lightning Bolt Strategy: https://www.mql5.com/en/market/product/83917
Telegram Community
Live ZOOM Sessions
Scheduled and impromptu zoom sessions hosted by the creator will be offered. During group zoom sessions confidence is developed by reviewing the Lightning Bolt trading strategy, reviewing trades and proper setups.
Article References
Chandelier Exit [ChartSchool] (stockcharts.com)
Average True Range (ATR) Definition & Formula (investopedia.com)
Measure Volatility With Average True Range (investopedia.com)
Chandelier Exit - Definition, How to Use, Formulas and Calculations (corporatefinanceinstitute.com)NOTICE: The information contained in this presentation is solely for educational purposes and does not constitute investment advice. The risks of trading in securities, Forex, and the futures market can be substantial. You should carefully consider if engaging in such activity is suitable to your own financial situation. The instructor on this channel is not responsible for any liabilities arising as a result of your Market involvement or individual trade activities.


