Supply and Demand Zone Advanced With Toggle Function
Before we go into our Supply And Demand Zone Advanced indicator lets get clear understanding about support and resistance
First, let’s define Support and Resistance:
Support – Area on your chart with potential buying pressure
Resistance – Area on your chart with potential selling pressure
Myths of Support and Resistance
- The more times Support is tested, the stronger it becomes.
- Support and Resistance are lines on your chart.
- You should place your stop loss at Support and Resistance.
Because these are the biggest lies about Support and Resistance trading strategy.
It is taught like this in trading books and courses. In this Blog we are going to see the right way of Trading with support and Resistance.
The more times Support or Resistance is tested, the weaker it becomes.
Because market reverses at Support because there is buying pressure to push the price higher. The buying pressure could be from Institutions, banks, or smart money that trades in large orders.
If the market keeps re-testing Support, these orders will eventually be filled. And when all the orders are filled, who’s left to buy?
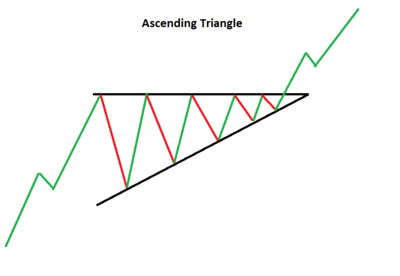
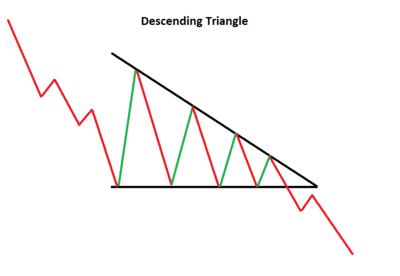
Higher lows into Resistance usually result in a breakout Ascending Triangle. Lower highs into Support usually result in a breakdown Descending Triangle.


Support and Resistance are areas on your chart and they are not lines
Because the price “undershoot” and you miss the trade or the price “overshoot” and you assume Support and Resistance is broken
Price will “undershoot” and you missed the trade
This occurs when the market comes close to your Support and Resistance line, but not close enough.
Then, it reverses back into the opposite direction. And you miss the trade because you were waiting for the market to test your exact Support and Resistance level.
Price will “overshoot” and you assume Support and Resistance is broken
This happens when the market breaks your Support and Resistance level and you assume it’s broken.
You trade the breakout but only to realize it’s a False Breakout
Support and Resistance can be dynamic
There are two ways to identify Dynamic SR.
One is Moving Average and the other one is Trend Line
Moving Average
Normally 20 & 50 and 200 Moving averages are used as Dynamic Support and Resistance
20 for short term trades,50 for medium term trades and 200 for long term trades
Trend line
These are diagonal lines on your chart to identify dynamic Support and Resistance.
Treat Support and Resistance as areas on your chart (and not lines). This applies to both horizontal and dynamic Support and Resistance.
Support and Resistance are the worst places to put your stop loss
But here are two things you can do
- Set your stop loss a distance from support and Resistance
- Wait for the candle to close beyond support and Resistance
Trading at Support or Resistance gives you favorable risk to reward
If you Enter trades when the price is far away from support and Resistance a large stop loss will be required and offers you a poor risk to reward.
But if you let price come to you, then you’ll have a tighter stop loss, and this improves your Risk to reward ratio.
Patience is very important necessity for trading. Stop chasing the markets and let price come to you.
If you Understand the concept behind support and resistance clearly and trade accordingly, it's sure that you will get good results consistently
Now it's Time to see our Supply And Demand Zone Advanced Indicator
As you know how much important the support and resistance zones, it's also very much time consuming and some what difficult process to draw these lines on the chart.
Also one of the main difficulty in using these support and resistance lines in our chart is we cant see the price movements clearly as there as many lines drawn, Moreover if we use some additional indicators it is too hard to look the price movements clearly.
For these real purpose unique support and resistance indicator as been developed , with this indicator we can HIDE or SHOW these support and resistance zones on the chart with a single click of the button on the chart.
Also a advanced algorithm is used in making of this indicator so that it will show us the strong zones,week zones,untested zones,untested zones and Turncoat zones.
You can also see or hide Fractals in the chart
I have Clearly explained in this video. if you still have any explanations or clarification don't hesitate to ask me. I am always ready to support you.


