

General Information
- Voenix is a Harmonic patterns scanner / Fibonacci patterns scanner / Chart patterns scanner utility that monitors all
selected pairs and timeframes. - You dont need to have multiple charts with Voenix running in them per the operation of the scanner.
It will monitor update and scan all selected assets from one chart (the chart its running on) - Do not change the symbol or the timeframe of the chart Voenix is running on as it will cause a reinitialization + restart.
- If you close your terminal with an active Voenix instance on a chart ,and then reopen it,Voenix will restart presenting you with the symbol selection screen.
- The symbols you choose (and timeframes) will be maintained (saved) once you click "Ready" on the symbol selection screen ,and will persist the next time you start Voenix
- The pattern settings , names , filter switches stops mode and stop levels will be stored once you click "Ready" in the pattern settings screen and will persist the next time you start Voenix.
- You cannot test Voenix in the Strategy Tester due to its multipair and multitimeframe nature(MT4) ,and ,the process of its setup as well -the stop at the instruments selection screen ,the stop at the pattern settings - (for MT5 where multipair testing would be possible.)
List of Harmonic Patterns and Chart Patterns that are in Voenix (MT4 + MT5)
- ABCD pattern
- Gartley pattern
- Bat pattern
- Cypher pattern
- 3Drives pattern
- Black Swan pattern
- White Swan pattern
- Quasimodo pattern or Over Under pattern
- Alt Bat pattern
- Butterfly pattern
- Deep Crab pattern
- Crab pattern
- Shark pattern
- FiveO pattern
- Head And Shoulders pattern
- Ascending Triangle pattern
- One Two Three pattern
- And 8 custom patterns
Symbol Selection Screen
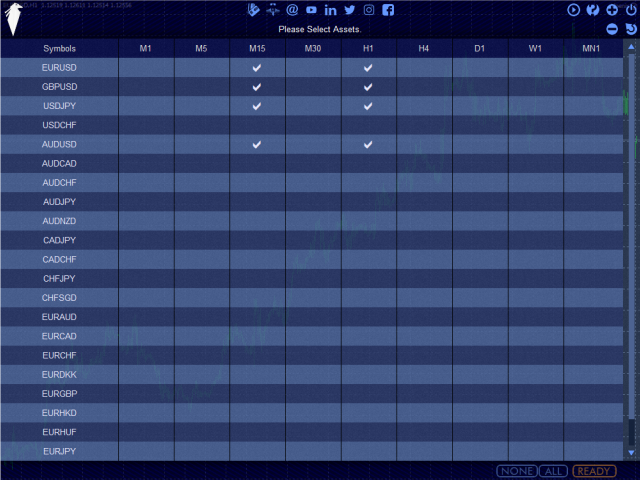
- Contains a list of all available instruments available in the MetaTrader Market Watch.
- 9 timeframes are available for selection for each instrument .
- You may select any timeframe from any available instrument (only limited by your systems RAM)
- If you click on a timeframe title (on the first title bar) then all timeframes will be selected/unselected - for all instruments in the list
- If you click on an instrument then all timeframes of that instrument will be selected/unselected - all timeframes
- Click "None" to remove all selected instruments and timeframes and "All" to select everything (not recommended though)
When ready click "Ready" , to allow Voenix perform a data download -if needed .You may see a loading screen depending on the amount of data that is already in the database .Once data is loaded the next subsequent load of Voenix will not reload existing data -will initialize faster-.You will later be able to filter results(found patterns) based on the Symbols or Timeframes (or both) you selected .
Pattern Settings
After required Instrument(s) Historic Data has been loaded ,or was already available,the Pattern Settings screen will open up.
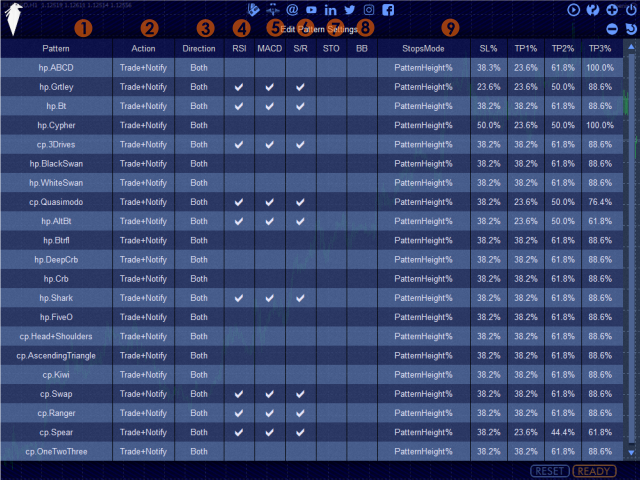
- Click on the pattern names to rename them if you wish to(1)
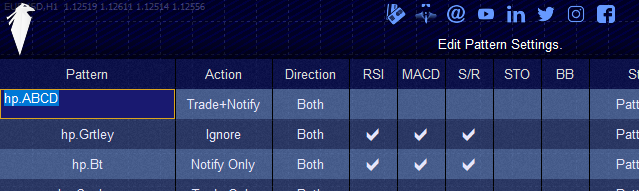
- Select how Voenix will treat the discovery of each pattern .You have the following choices :(2)
Ignore : There will be no notification and no trading of this pattern.(it wont be detected at all)
Notify Only : The pattern will be detected and you will be notified for it ,if alerts-master switch- are on (you have direct live access to that switch on the patterns table)
Trade Only : The pattern will be detected and will be traded ,if trading -master switch- is on (you have direct live access to that switch on the patterns table)
Trade+Notify : The pattern will be detected and traded-notified in accordance with the master switches which are available on the patterns table.
*Note , if you have Trade switch off ,and the Alerts switch off the patterns that are not set to be Ignored they will be detected and logged in the Patterns Table. - Select which direction of each pattern will be detected(3).
Both : Both bullish and bearish sides will be detected.
Bullish : Only bullish instances of this pattern will be detected.
Bearish : Only bearish instances of this pattern will be detected. - RSI Filter ,enable or disable filtration .Click on the RSI title to enable/disable it for all patterns(4).
- MACD Filter , enable or disable filtration .Click on the MACD title to enable/disable it for all patterns(5).
- S/R ,support / resistance ,enable or disable filtration .Click on the S/R title to enable/disable it for all patterns(6).
- STO Filter , enable or disable Stochastic Oscillator filtration.Click on the STO title to enable/disable it for all patterns(7).
- BB Filter , enable or disable Bollinger Bands filtration.Click on the BB title to enable/disable it for all patterns(8).
for the 5 filters above :They will be applied to all patterns and only patterns that meet the criteria specified will be traded .But ,when it comes to logging patterns on the patterns table ,if you have enabled "Show Patterns Regardless of filters settings" ,all detected patterns (those not set to "Ignore") will be displayed along with the state of the filters.This behavior is present to assist you in deciding on your filters -seeing all results and their filter status-
*If you want only patterns with valid filters to be logged on the pattern table disable "Show Patterns Regardless of filters settings"
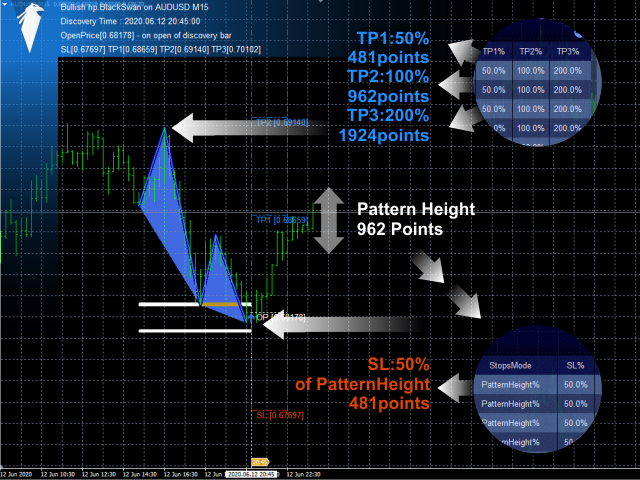
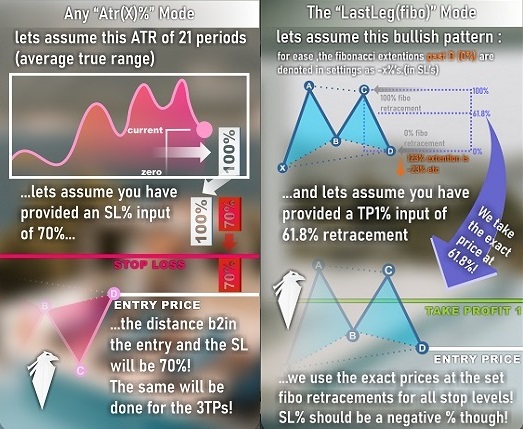
- Stop Loss Modes for each pattern (9)
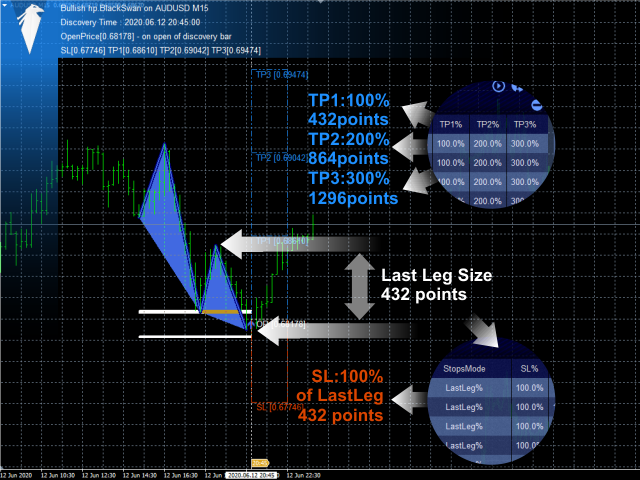
Pattern Height % : The highest minus the lowest points of the pattern will determine the height of the pattern in points . That will represent the value 100% and from there the stops %'s settings will be used to calculate the size of StopLoss and TakeProfits depending on the pattern height.
- Last Leg % : The last leg of the pattern , the most recent move, its size in points will represent the value 100% which will be used with stops % settings for that pattern to calculate StopLoss and TakeProfits sizes.
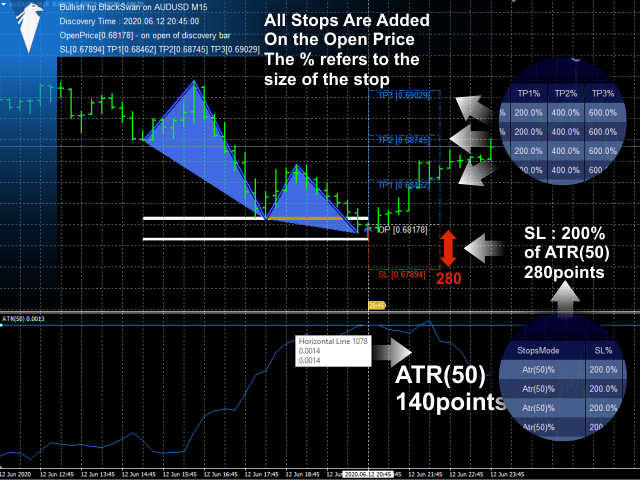
Atr(14)% : The Average True Range in points of 14 periods (depending on the timeframe scanned) will represent the 100% value in order to calculate the StopLoss and TakeProfits size in conjuction with the stops% settings.
Atr(21)% : The Average True Range in points of 21 periods (depending on the timeframe scanned) will represent the 100% value in order to calculate the StopLoss and TakeProfits size in conjuction with the stops% settings.
Atr(35)% : The Average True Range in points of 35 periods (depending on the timeframe scanned) will represent the 100% value in order to calculate the StopLoss and TakeProfits size in conjuction with the stops% settings.
Atr(50)% : The Average True Range in points of 35 periods (depending on the timeframe scanned) will represent the 100% value in order to calculate the StopLoss and TakeProfits size in conjuction with the stops% settings.
- All stops settings % , are in % values -and not in points -to accomodate different instruments volatility
- Click on the "StopsMode" title to change the stops mode for all patterns at once.
- Similarly , when you click on the "SL%" title you will be prompted to enter a % value -like when clicking on a patterns SL box for editing- .That % value will then be applied to all patterns.
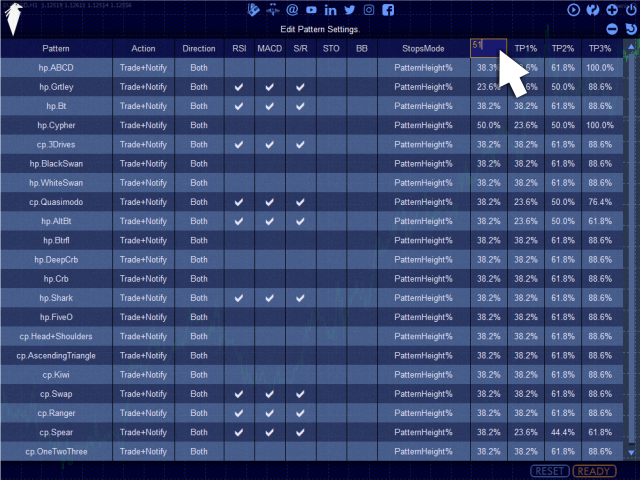

- The same edit is available for TP1 ,TP2 ,TP3 percentages.
The pattern scanning process will initiate and a screen will appear to indicate that.
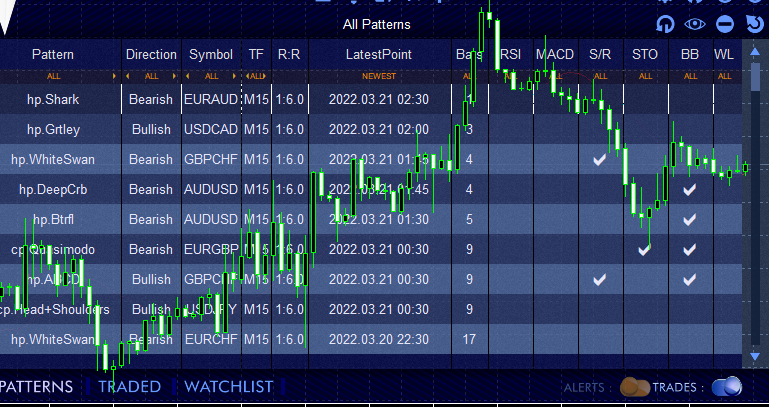
Pattern Table Screen
Table Of Patterns :: Columns
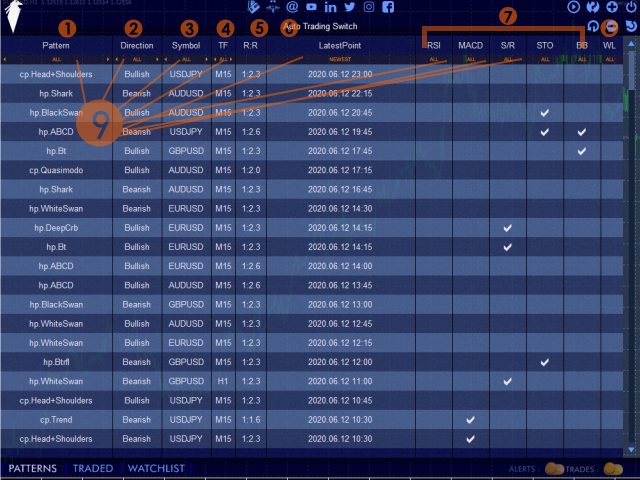
- Pattern : The name of the discovered pattern (1)
- Direction : The direction (of the trade) of the pattern (2)
- Symbol : The symbol the pattern was discovered in (3)
- TF : The timeframe of the symbol the pattern was discovered in (4)
- R:R : Risk to Reward Ratio Risk always 1 (so 1:2 is take profit 3 is twice the stop loss) (5)
- LatestPoint : The pattern discovery time ,essentially the time of open on the candle immediately following the last point (most recent) of the pattern.(6)
- RSI : Allowed or not by RSI filter on the specific symbol on the specific timeframe (7)
- MACD : Allowed or not by MACD filter on the specific symbol on the specific timeframe (7)
- S/R : Allowed or not by Support/Resistance filter on the specific symbol on the specific timeframe (7)
- STO : Allowed or not by Stochastic filter on the specific symbol on the specific timeframe (7)
- BB : Allowed or not by BollingerBands filter on the specific symbol on the specific timeframe (7)
- WL : In WatchList or Not - Watchlist is manually controlled by the user (8)
Table Of Patterns :: Filter Row (in orange letters under column titles) (9)
- Pattern Name Filter Toggle : You can choose to only display specific patterns on the table or all ,you can reset the filter (to "All") by clicking the "Pattern" title above it.
- Direction Filter Toggle : You can choose to display only bullish or only bearish or All patterns and you can reset the filter (to "All") by clicking the "Direction" title above it.
- Symbol Filter Toggle : You can choose to display patterns found in a specific symbol ,from the array of symbols you have selected ,you can reset the filter (to "All") by clicking the "Symbol" title above it.
- Timeframe Filter Toggle : You can choose to display patterns found on any of the 9 timeframes ,provided they are selected,and you can reset the filter (to "All") by clicking the "TF" title above it.
- Sort By Newest Or Oldest First : Click the filter toggle under "LatestPoint" to switch between these two time sorting modes .The default one is "Newest"
- RSI , MACD , S/R , STO / BB Filter Toggles : You can choose to see only patterns which have their respective column filter valid or not .
When you see the filter state being in "All" you will see all patterns (regardless of valid or invalid filter state) ,"True" for only patterns that have the filter in valid state and "False" for only patterns that have the filter in non-valid state.The state of the indicators displayed is not about the filter being on or not but whether or not the filter would allow the pattern or not regardless of it being on or off in the pattern!
Example :
The RSI Filter with an overbought zone at 80.
When the rsi is over 80 then ,selling -rsi theory- is more likely to occur .
So ,the RSI display in the Patterns Table (with the results) if its checked[true] for a bearish pattern (sell-short-bear) it indicates that rsi at the latest point of the pattern is over 80 and if not checked[false] for a bearish pattern it indicates that rsi is below 80.
So this RSI display indicates whether or not the filter would allow that trade ,and its controlled by the EA ,whereas, the RSI display on the PatternSettings is controlled by you and its about whether or not you want a pattern to be filtered by RSI.
- WL Filter Toggle : You can choose to see only patterns that you have placed in the watchlist with "In" ,not in the watchlist with "Out" and all ,and can reset the filter by clicking the "WL" title above it.
- There is also a full filters reset button left to the Font Size Decrease button which will reset all filters to their default state .
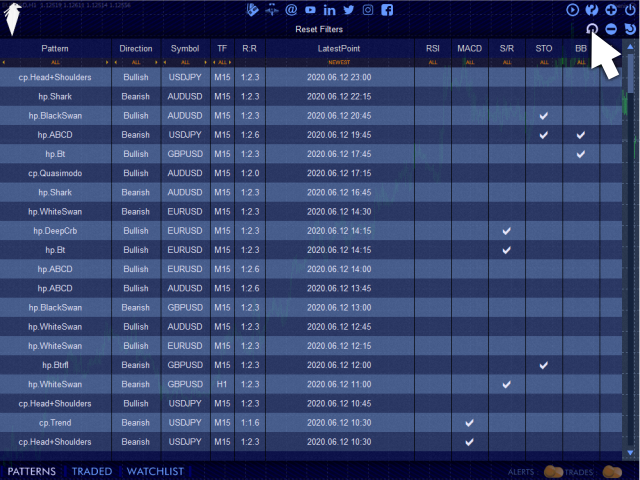
The filters persist across all displayed categories , "Patterns", "Traded" and "Watchlist".
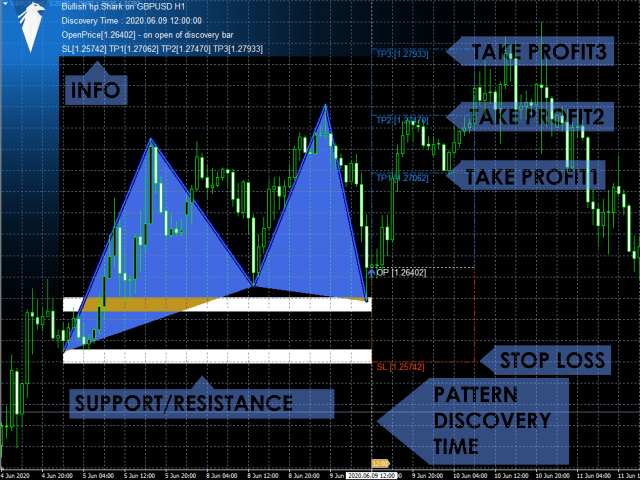
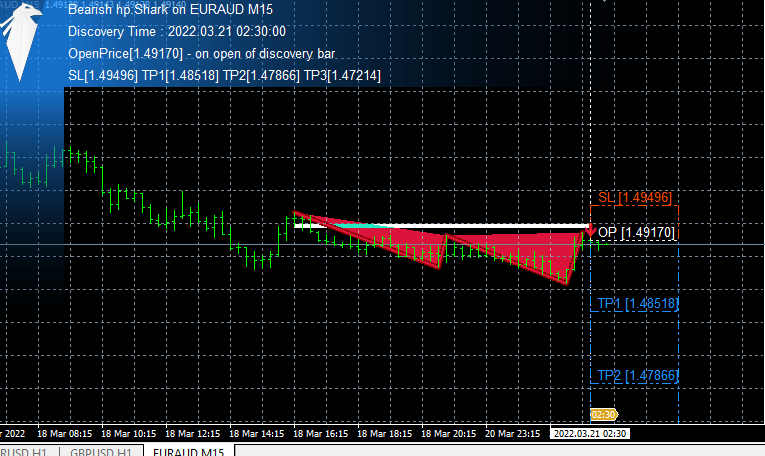
Clicking on any of the discovered patterns will open up a new chart on the symbol and timeframe the pattern was found
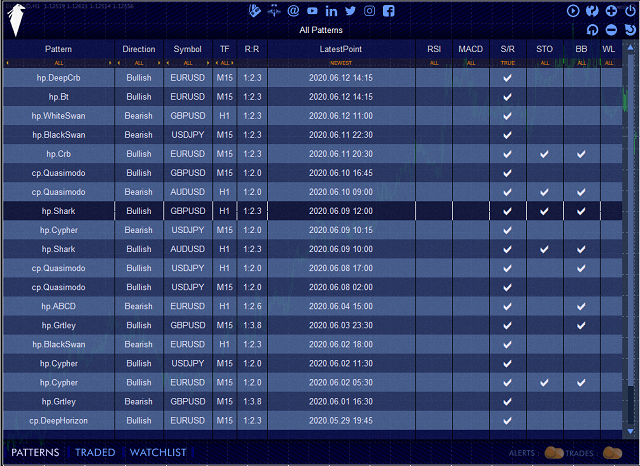
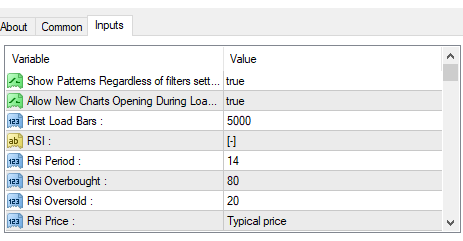
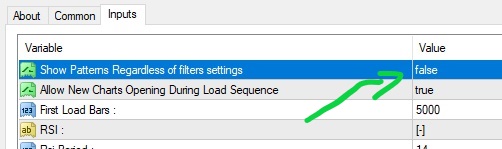
Show Patterns Regardless of filters settings :
- True , show patterns that do not meet the criteria set by your indicator filter settings (it may help in identifying best filtration settings) -If trading is on they wont be traded-
- False , only show patterns that meet the criteria
First Load Bars : The amount of bars for initial historical scans for each pair and timeframe selected . Do not set this below 1000 .The bigger the number the more the scanner will look into historic bars if it exists.
Rsi Period : Period For Rsi Filter-as in the rsi indicator settings
Rsi Overbought : Level above which rsi signals overbought conditions - for Bearish/Short/Sell patterns.
Rsi Oversold : Level below which rsi signals oversold conditions - for Bullish/Long/Buy patterns.
Rsi Price : Price for Rsi filter -as in the rsi indicator settings
Period : Bollinger Bands Period - indicator setting for BB filter -as in the BollingerBands indicator settings.
Deviation : Bollinger Bands Deviation -indicator setting for BB filter -as in the BollingerBands indicator settings.
Applied Price : Bollinger Bands Applied Price -indicator setting for BB filter -as in the BollingerBands indicator settings.
3 settings for forming the conditions for the BB filter to allow Bullish/Long/Buy patterns
- Buy when price has ... (choices : "Closed"/"Reached")
- ... (choices : "Above"/"Below")
- the ... band (choices : "Top"/"Middle"/"Bottom")
So what is going on in this type of setup is the above 3 settings are allowing a selection of terms which are placed in the "..." in order to form an entire sentence which in turn becomes the rule for allowing the Bullish/Long/Buy patterns.
For instance "Buy when price has Closed Above the Middle band"
Closed means that the Bar/Candle actually closed above or below the specified level while Reached means there was a high above or a low below the specified level
For the Bollinger Bands filter these conditions will be applied on the bar on the last point of the pattern (the most recent point)
Same set of 3 settings for Bollinger Bands filter for the Bearish/Short/Sell patterns :
- Sell when price has ... (choices : "Closed"/"Reached")
- ... (choices : "Above"/"Below")
- the ... band (choices : "Top"/"Middle"/"Bottom")
For instance "Sell when price has Reached Below theBottom band"
Fast Ema Period : MACD Fast Ema Period - indicator setting for MACD filter -as in the MACD indicator settings.
Slow Ema Period : MACD Slow Ema Period - indicator setting for MACD filter -as in the MACD indicator settings.
Signal Period : MACD Signal Period - indicator settings for MACD filter -as in the MACD indicator settings.
Applied Price : MACD Applied Price - indicator settings for MACD filter -as in the MACD indicator settings.
2 settings for specifying when Bullish/Long/Buy patterns should be given a pass by the MACD filter.
- Buy when MACD is ... signal line (choices : "Above"/"Below")
- and MACD ... the signal line (choices : "Approaches"/"Pulls Away From"/"Anything To")
Again a sentence is formed with these settings to dictate the MACD filter behavior.
for instance "Buy when MACD is Above signal line and MACD Pulls Away From the signal line"
For determining if the MACD is approaching or pulling away from the signal line ,the 3 latest bars of the selected timeframe are used -the scanned timeframe not the charts timeframe.
2 more settings of similar type follow for Bearish/Short/Sell patterns.
- Sell when MACD is ... signal line (choices : "Above"/"Below")
- and MACD ... the signal line (choices : "Approaches"/"Pulls Away From"/"Anything To")
K Period : StochasticOscillator K Period - indicator setting for STO filter -as in the StochasticOscillator indicator settings.
D Period : StochasticOscillator D Period - indicator setting for STO filter -as in the StochasticOscillator indicator settings.
Slowing : StochasticOscillator Slowing - indicator setting for STO filter -as in the StochasticOscillator indicator settings.
Ma Method : StochasticOscillator Ma Method- indicator setting for STO filter -as in the StochasticOscillator indicator settings.
Price Field : StochasticOscillator Price Field- indicator setting for STO filter -as in the StochasticOscillator indicator settings.
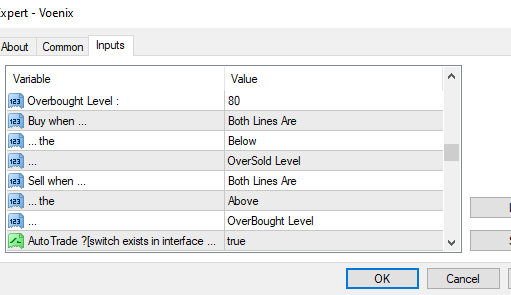
Oversold Level : Level below which stochastic signals oversold conditions - for Bullish/Long/Buy patterns.
Overbought Level : Level above which stochastic signals overbought conditions - for Bearish/Short/Sell patterns.
3 settings follow for dictating the behavior of the STO filter when it comes to Bullish/Long/Buy patterns.
- Buy when ... (choices : "Main Line Is"/"Signal Line Is"/"Both Lines Are")
- ... the (choices : "Above"/"Below")
- ... (choices : "OverBought Level"/"Middle Level"/"OverSold Level")
As before ,the sentence formed is the instructions that the STO filter will use.
for instance "Buy when Both Lines Are Below the OverSold Level"
*the Middle Level is at 50 by default
An additional 3 settings follow for the Bearish/Short/Sell pattenrs.
- Sell when ... (choices : "Main Line Is"/"Signal Line Is"/"Both Lines Are")
- ... the (choices : "Above"/"Below")
- ... (choices : "OverBought Level"/"Middle Level"/"OverSold Level")
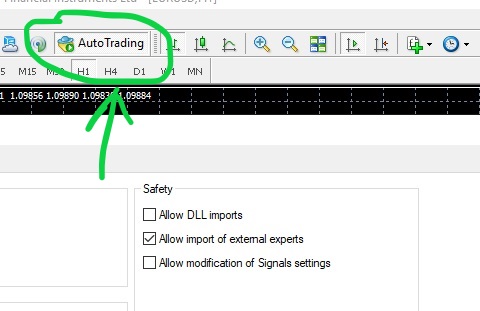
AutoTrade ?[switch exists in interface as well] : Enable or Disable autotrading ,as stated in the input , a switch is also available on the Voenix Live panel.
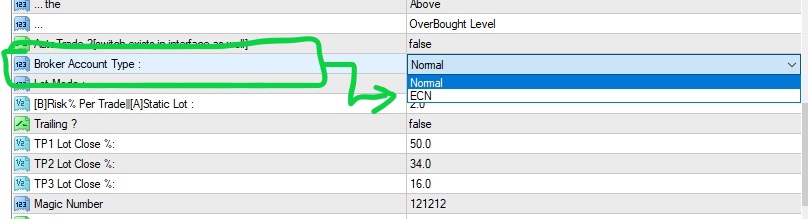
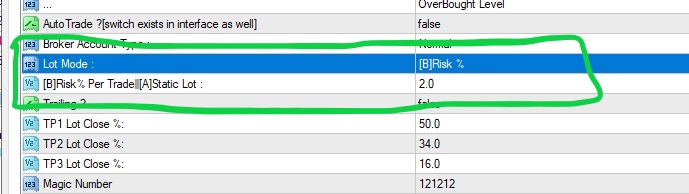
Broker Account Type : Normal or ECN
Risk Per Trade , % : Risk per trade as in the amount that will be lost in percentage of the equity if the trade hits the Stop Loss.
Trailing ? Enable or Disable trailing.
Trailing is based on the 5 levels of a trade which are :
- StopLoss
- OpenPrice
- TakeProfit1
- TakeProfit2
- TakeProfit3
When TP1 is hit the SL will move to OpenPrice , when TP2 is hit the SL will move to TP1 ,when TP3 is hit nothing will happen as the entire trade will be closed.
TP1 Lot Close %: Amount of the order that will be closed when TakeProfit1 is reached
TP2 Lot Close %: Amount of the order that will be closed when TakeProfit2 is reached
TP3 Lot Close %: Amount of the order that will be closed when TakeProfit3 is reached
StopLoss will close 100% of the trade whether its hit normally or after trailing.
Magic Number : Magic number , used to ID the Voenix trades if you want to monitor your account performance by multiple ea's.
Notifications ?[switch exists in interface as well] : Enable or Disable notifications ,as stated in the input ,a switch is also available on the Voenix Live panel.Where you receive notifications depends on the following 3 settings :
- Notifications : PopUpAlerts ? Show MT4 alert box notification.
- Notifications : eMails ? Receive email notification -if you have it setup.
- Notifications : Mobile ? Receive notifications in the MT4 mobile App -if you have it setup.
*The Meta Trader 4 mobile app ,there is no Voenix Mobile App , yet*
Open With Template ? Enable opening of pattern charts -the charts that open up when you click on a discovered pattern on the pattern table- using a template . ,if you enable this specify the template in "Template to Use (must exist)" including the .tpl extention.
The template must be in the templates folder of the terminal.
Display Indicator Values on open charts : Display the values of the indicators on the charts of discovered patterns when opening them.
Photo explaining 4 of the stop modes for each harmonic pattern (or chart pattern or fibonacci pattern).I apologize if it looks draft ,and hastily put together - thank you.
If you have already purchased , you can request the original Voenix (the old version) be sent to you like so :
Trailer :


")