

Magical indicator Sigma
It is natural that everyone wants to make the most profitable trades, but most people fail to do so. (Why?).
This secret has always been kept behind the scenes.
Probably what you hear here will shock you.Because the truth is not what most people want you to know.
Because there will be a lot of profit at stake.
There is no holy grail.
You need a fully mechanical system that has a clear entry and exit point to succeed
So you can control your emotions and this can guarantee your success.
And this is what you were looking for
This indicator is free for a limited period of 4 weeks .
You can review and take-back test without paying any money and no risk.
You can download the indicator from here https://www.mql5.com/en/market/product/42786
We designed an expert based on the indicator introduced and tested the trading systems and you can see the results in the video below.
Of course we hope you build your own trading system.
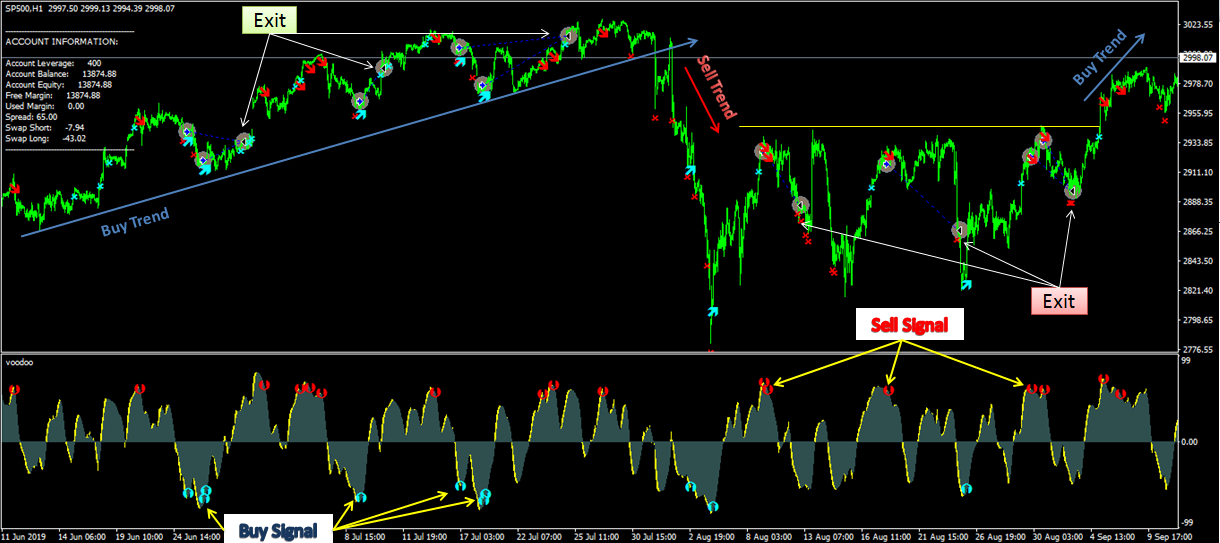
The First Strategy
Step 1: Determine the trend
Higher high and higher lows ==> UpTrend.
Lower lows and lower highs ==> Down Trend.
Step 2: Take signal
If market is UpTrend only take bullish signal.
If market is DownTrend only take bearish signal.
Step 3: Determine your StopLoss
Between 1 and 3 percent of the account (or your personal opinion).
Step 3: Exit point
Set the period 30 to 70 for Exit buy signal and Exit sell signal.

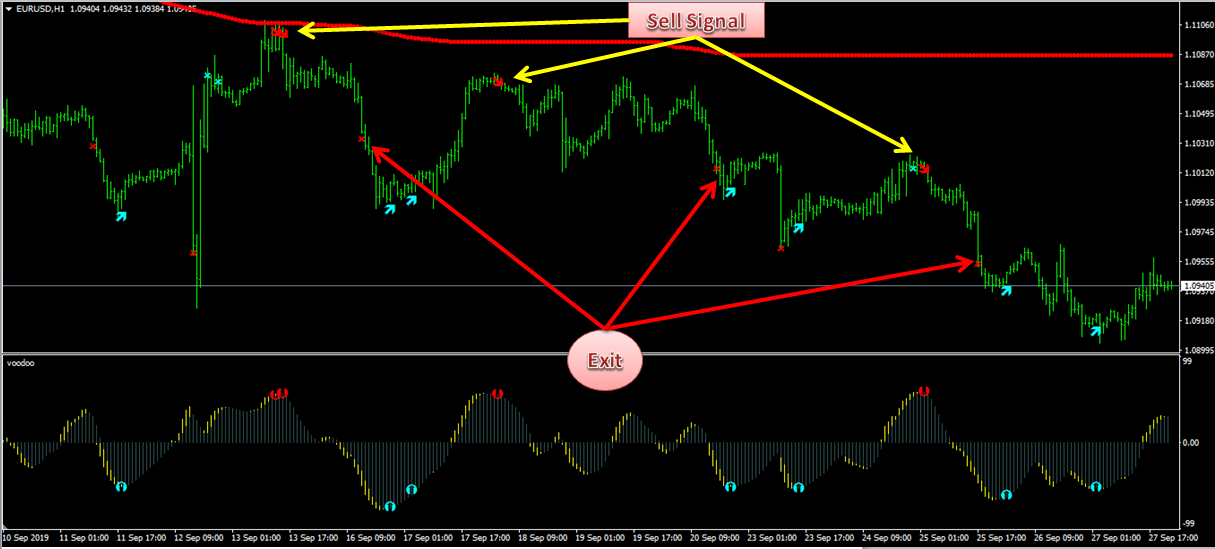
The Second Strategy
Buy Mode: If arrow signal is buy, you buy and if the next buy signal is lower than the pervious buy signal, you add to the volume of position.
Sell Mode: If arrow signal is sell, you sell and if the next sell signal is higher than the pervious sell signal, you add to the volume of position.
Exit Point : When you see the exit signal.( You can also use Rsi indicator or BollingerBand).
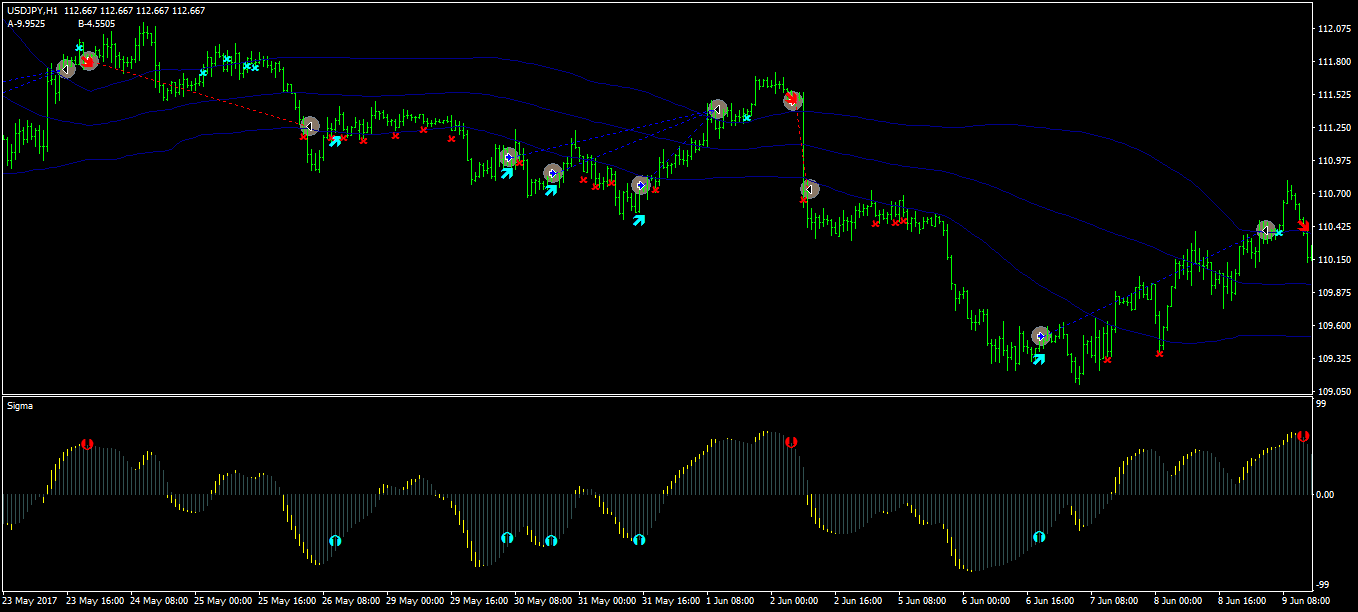
The Third Strategy
Buy Mode: If arrow signal is buy and price lower than Bollingerband (deviation=1 , period=X) , you buy and if the next buy signal is lower than the pervious buy signal, you add to the volume of position.
Sell Mode: If arrow signal is sell and price higher than Bollingerband (deviation=1 , period=X) , you sell and if the next sell signal is higher than the pervious sell signal, you add to the volume of position.
Exit Point : When you see the exit signal.( You can also use Rsi indicator or BollingerBand).
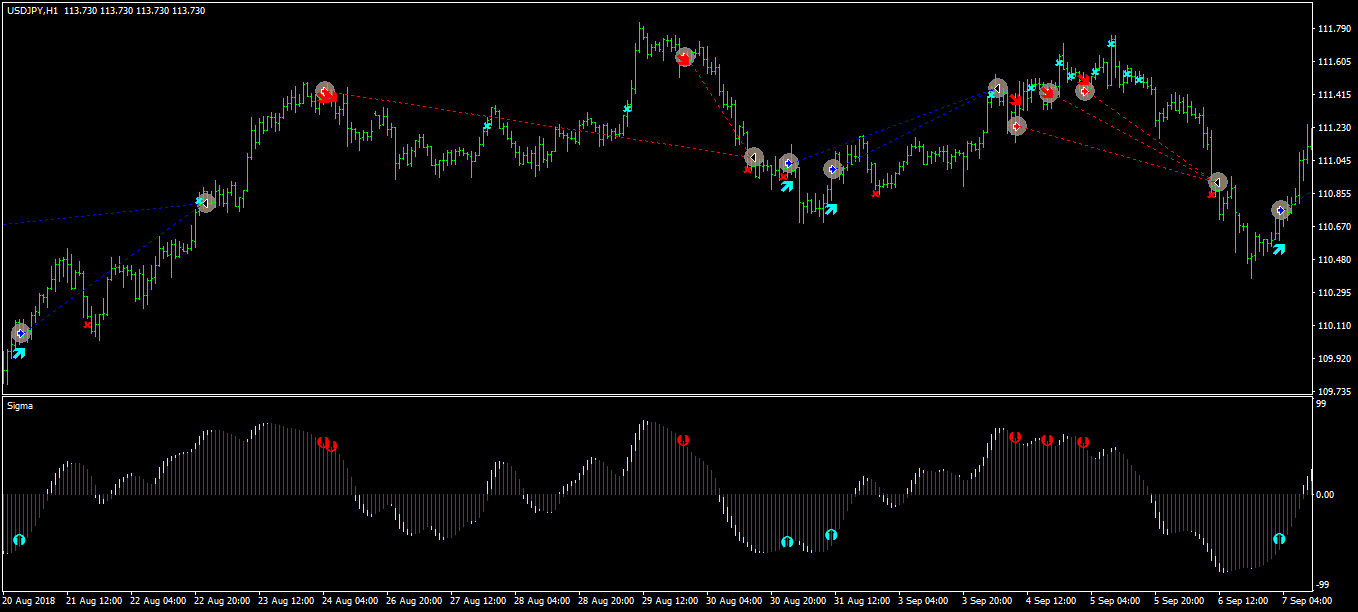
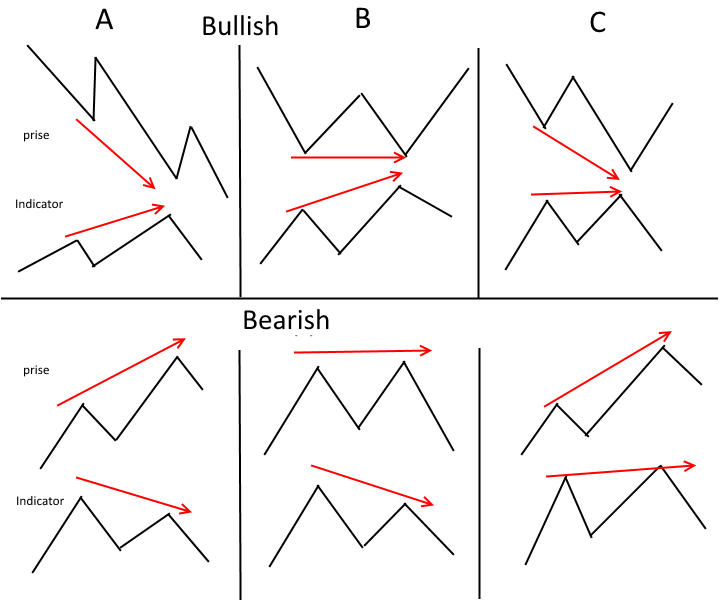
The Fourth Strategy
Convergence and Divergence

Thank you for your accompaniment


