

The principle of the indicator.
The Bollinger Bands without lag (BBWL) indicator is a very effective (for manual and automatic trading) development of the famous Bollinger Bands indicator (BB). The classic BB indicator is a moving average, on both sides of which the standard deviations of std are multiplied by the corresponding coefficient (2.0 by default). At the same time, a moving average with an averaging period (2n + 1) bars is always obtained lagging by n bars, which are lagging behind and sliding std, also calculated by (2n + 1) points. Such a strong delay reduces the efficiency of using ВВ in trade.
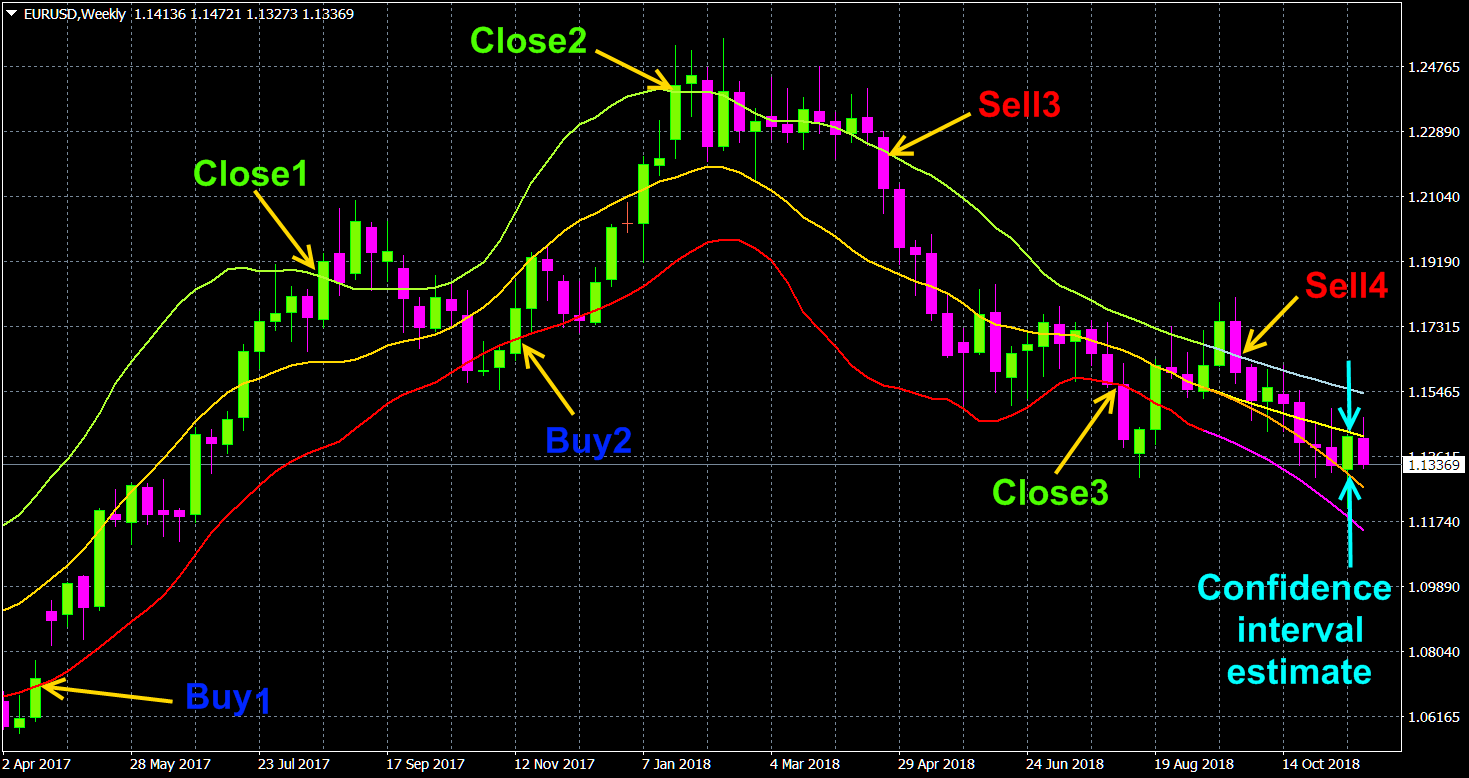
The BBWL indicator is constructed in the same way as a classic BB, but only on the basis of the non-lagging moving average. The non-lagging average is calculated at the points (Inf, n + 1] in the usual way, and at the points of the segment [n, 0], where 0 is the number of the last bar, algorithmically. The non-lagging average (at points [n, 0]) is the most probable line of the non-lagging average, which is also girded by non-lagging std, which is also determined by a set of the most probable values of this std at points [n, 0], where the non-lagging average and non-lagging standard deviation are cannot be directly calculated. The BBWL indicator also provides for the mode of calculating the confidence interval (0.95), in which the non-lagging average fits with the corresponding probability. This mode is enabled by setting the option “Moving average without lag scatter estimate” to true.
Trade
using the Bollinger Bands without lag indicator.
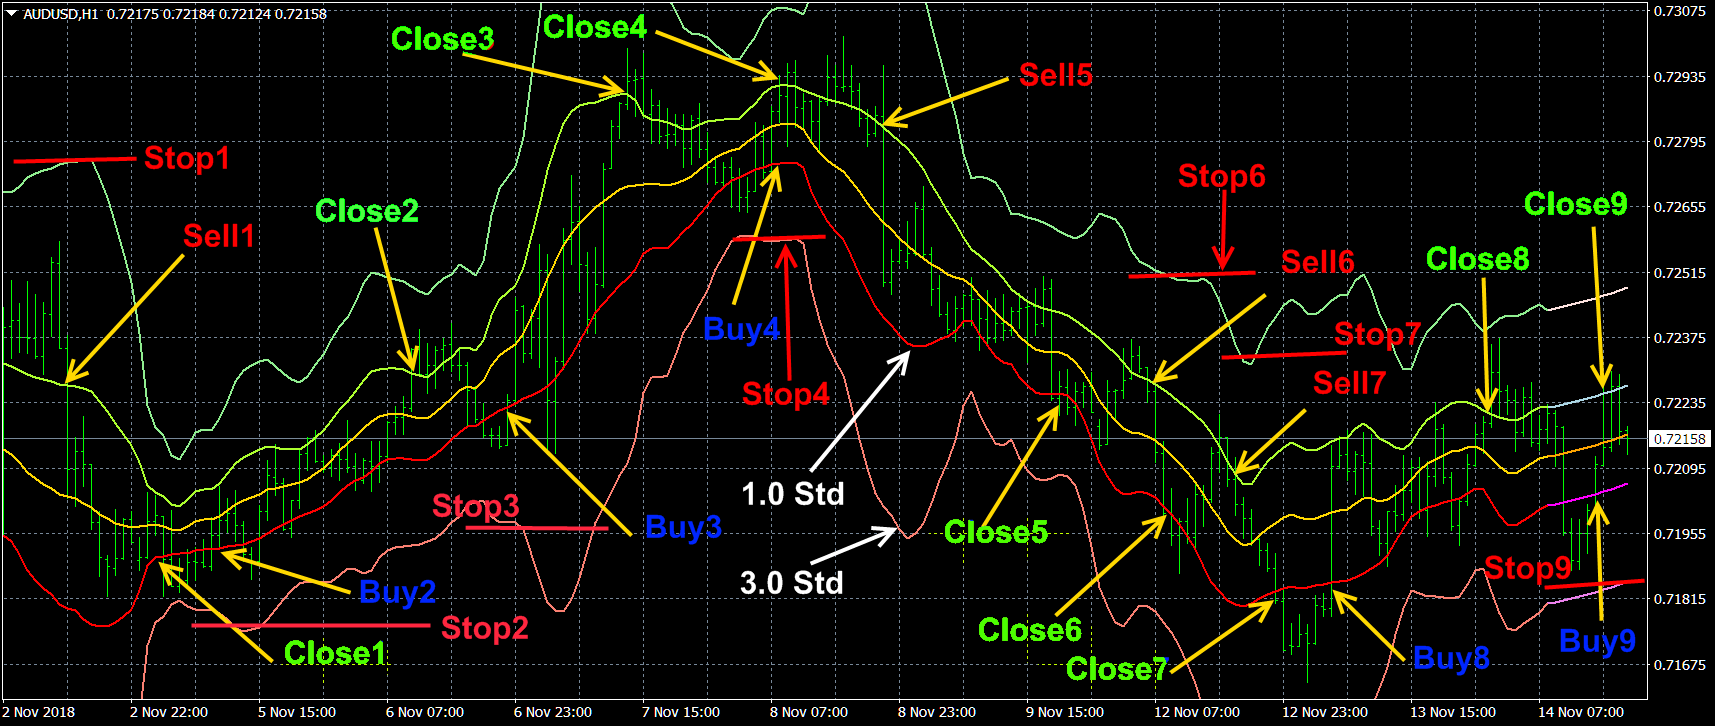
The BBWL indicator builds a accurate channel into which uniformly concentrates (almost in 1.0 std. and without shifting to the bottom line of the indicator on a downtrend and shifting to the upper line during an uptrend, as in classical BB) all price fluctuations. At the same time, the middle line gives directly (without any delay) the most likely value for the current price, and the upper and lower ones give the real boundaries of the channel of its oscillations. Therefore, when the price exceeds the upper line, it is necessary to open a position on Sell, and when the price decreases the bottom line it is necessary to open a position on Buy, which, of course, if there is a pronounced trend, it should be done taking into account its direction, ie do not play against this trend. The presence of a trend is determined by the slope of the non-lagging moving average. Closing positions, on the contrary, Sell when the price drops below the bottom line, and Buy when the price rises above the top. Stop_Loss for the positions to be opened should also be placed along the lines of the Bollinger Bands without lag indicator, but only with 3.0 std in the "Channel width in factor" option, which are almost never exceeded by the price in the "Price type" option.
Indicator settings.
- Price type - applied price. Values: Close price, Open price, High price, Low price, Median price ((high + low)/2 - default), Typical price ((high + low + close)/3), Weighted price ((high + low + 2*close)/4).
- The averaging method - averaging method. Values: Simple, Exponential (default), Smoothed, Linear weighted.
- The averaging period - averaging period. Any integer (21 by default).
- Channel width factor in STD - channel width factor in standard deviations. Values: any real number, 1.0 by default.
- Moving average without lag scatter estimate - mode of calculation of the confidence interval for a non-lagging moving average. Values: false (default), true.
Screenshots.

Download or buy next generation StatChannel
indicator can be on the link.


")