")
Volume Analysis Indicator (see the direction the big banks are moving the volumes )

We are introducing our new revolutionary forex indicator named 'Volume Strength 28 ' . Before we delve into the indicator functionality we want you to understand somethings the pro knows that makes them successful.
Volume always precedes price. That is why it is very important to understand volume if you want to spot an early change in trend . Also fake moves such as a fake breakout are most times accompanied by small volumes that doesn't compliment the price spike . You need to understand volume to see where the big banks and hedge funds are trying to move the market , what these guys do is that in a range bound condition they always accumulate the volume of one currency in the direction they want to move the market, you might not easily spot this mere looking at one chart but if you take an overview of the total currency pairs you will be able to easily spot their move . Thus if you want to see the move before it happens, take your eyes from the price and look at the volume.
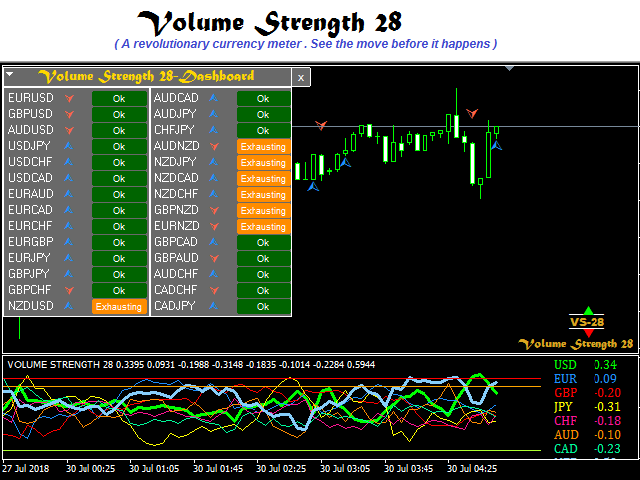
Volume Strength 28 is a currency meter that is different from any you’ve come across. Typical currency meters found in the forex markets/community uses price as bases of their analysis however this currency meter uses volume as the bases of its analysis.
Volume strength 28 analyses the trade volume of 28 currency pairs and defines the strength of a currency based on volume. With this logic you can easily spot both micro and macro moves in a currency pair even before they happen.
Applications
There are many applications of the Volume Strength 28 but we are just going to highlight a few we have been able to define with success. I encourage every user of this product not just to focus on these few applications but to study and discover it more because we are still yet to exhaust its applications.
- Spot strong / weak currencies.
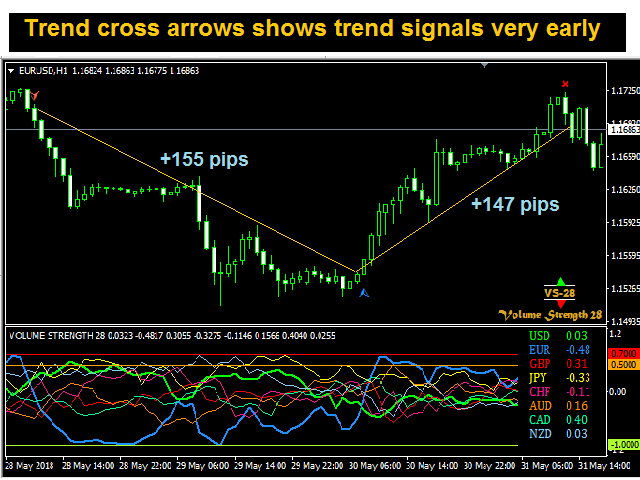
- Spot trends at its earliest stage.
- Know the stage of trend and the best time to enter trades.
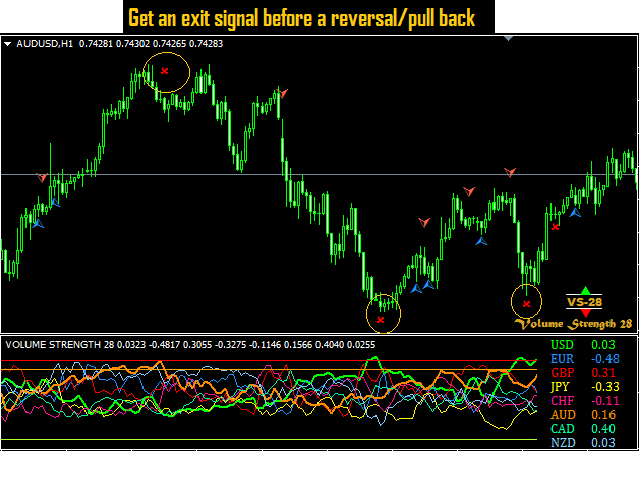
- Spot the end of a trend.
- Spot reversals at its early stage.
- Spot pull backs at its earliest stage.
- Spot fake moves
Features
- Trend Arrows: Has pair cross arrows to show trend change on charts
- Trend Exit Arrows: Has trend exit arrows to identify the end of a trend and possible reversals/pull backs
- Multi-Currency Dashboard: It has multi-currency dashboard for display of trend direction and trend stage for 28 currency pairs.
- Trade Zone Lines: It has trade zone lines to define the stage of the trend. Green Zone is the tradable zone, Yellow Zone is the exhaustion zone /no trade zone and the Red Zone is the exit zone.
- Notification/ Alert: The indicator has pop up notification, email notification and push notification for trend change and trade zones.
How to Use
Make sure all data are loaded to get correct strength values. Incomplete data will be displayed on the screen. Incomplete might return wrong strength values thus they should be updated.
Green Zone Line
The green zone is the recommended zone for trades, the zone is between -1.0(100% on the negative region) to 0.49 (49% on the positive region). From a series of test done, we discovered most trades outside this region ends in loss because reversal /pull backs are imminent outside this region.
Yellow Zone Line
The yellow zone represents the beginning of trend exhaustion, the zone is between 0.5 (50 %) to 0.69 (69%). At this region it recommended to stop trading and look for exits.
Red Zone
This zone represents where the trend is exhausted. It depicts the overbought/oversold conditions of each pair. A move below this level from the top represents a trend reversal/pullback and this should be an exit point.
Time Frame: Can be used on any Time Frame
Download/Purchase @ https://www.mql5.com/en/market/product/30575#


