What are Renko Charts?
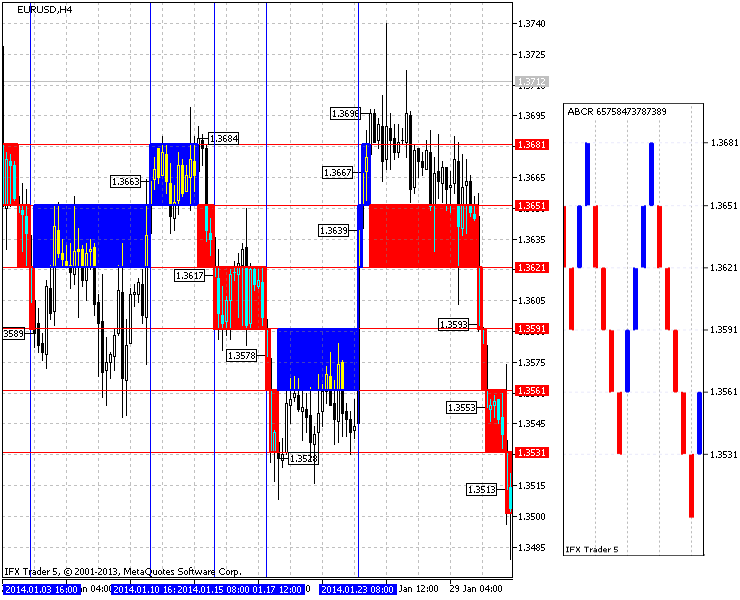
The Renko Charts have been developed by Japanese which are
built on price movements rather than time and volume. Renko Charts are formed
in bricks which is precisely why its called Renko named after ‘Renka’ which is
called bricks in Japanese.
What makes Renko Different?
Renko Charts do not factor in time and volume but rather move according to the
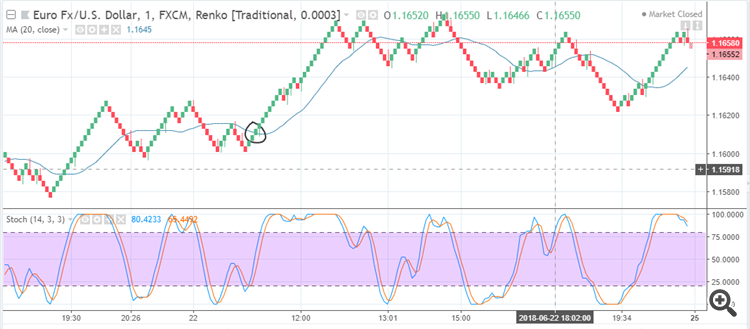
movement of Price. There are two different colors in Renko. The Green Brick
depicts the price has moved higher as compared to last brick while the Red
Bricks indicates price going down as compared to last brick. This makes the charts
easier to understand and identify trends.
What Advantage will I get in using Renko?
The major advantage of using Renko is limit the market noise or rather you can
say eradicate noise. Renko eliminates the small price movements and frequent
corrections and resistance using candles. Another major benefit is an investor
can get rid of range bounded movements. The Range Bounded trading is seen as a major
hurdle for a day trader. Renko helps a trader getting rid of these areas by
covering small price movements.
How is Renko formed?
The Renko are made in bricks according to the brick size. The Brick Size represents
the upper and lower price limit of the brick. For example a brick size of 100
means 10 pip value of a currency pair. Lets say EURUSD is trading around 1.20000
and 1.20200. If a brick size 100 is selected. The brick will form according to
the price movement. If the price is between 1.20000 and 1.20100, the lower
limit would be 1.20000 and upper limit would be 1.20100. A new brick will not be
formed till the price either breaks the upper limit. No matter how much time it
takes, the brick will remain at its position since the price is fluctuating in
between 1.20000 and 1.20100. When the price breaks 1.20100, new brick will be
formed.

How can we use Renko in our Trading?
Since Renko charts helps us remove noise and false signals, it can be used in
conjunction with other indicators. The moving averages, support and resistance,
oscillators can give us a better picture in Renko charts than the Traditional
Candlestick charts.
Disadvantage of Using Renko and their solutions
The biggest disadvantage of using renko is missing out price movement
information if you have chosen a larger brick size or a bigger timeframe. For
this purpose, an investor is advised to use an ideal size for renko trading. He
can either do so by using Average true Range option in Renko Indicator and
choose a smaller brick size (but not small enough to overcome commissions).
The other big disadvantage is using bigger timeframe. The indicators used along
with Renko would not indicate until the time period selected in timeframe is
not over. This would result in several missed Renko Bricks. The solution would
be using 1 minute timeframe. (M1). Do not worry. This does not mean you can miss
out good entries. A better renko brick size along with 1 minute timeframe would
help formation of renko bricks and Indicators at the right time.
NOTE: THIS ARTICLE ONLY COVERS THE BASICS OF RENKO. IT DOES
NOT COVER THE PROGRAMMING MECHANISMS OF THE INDICATOR AND EXPERT ADVISOR
ABOUT THE AUTHOR:
Ammar Yaseen loves to explore the boundaries of MQL5. His adventures in this
new world of Finance and trading has led him to develop new indicators and
Expert Advisors.


