Current dynamics
The failure of the Trump administration with the draft of the new health law forced many investors to question its ability to fulfill Trump's promises during the campaign to support business in the United States. As you know, on Friday the Republicans withdrew from the vote in the US Congress the question of a new health bill, without enlisting the support of the majority of congressmen. Doubts about the success of the Trump administration began to appear at the beginning of last week. As a result, over the past week, the leading US stock indices recorded the largest drop in the last few months.
Reform of the health system was considered the first real test of the capabilities of the new administration. And now failure can cast doubt on the other legislative projects of Trump.
Doubts about Trump's ability to pursue a stimulating policy that would support the growth of stocks and the yield of government bonds caused a drop not only in the indices, but also in the dollar across the entire foreign exchange market.
The ICE dollar index fell on Friday to a minimum since mid-January 99,627 against 99,760 on Thursday. The S & P500 index fell 0.1% on Friday to 2,343.98 points, and by the end of the week, it fell 1.4%, which was its worst result since November. The Dow Jones Industrial Average dropped 0.3% to 20596. Its weekly decline reached 1.5% and was the highest since September. Prices for US Treasury bonds rose, and the yield on 10-year bonds fell to 2.396% from 2.418% on Thursday.
Nevertheless, Donald Trump tried to reassure investors, saying, "we will undertake a very large effort for a significant reduction in taxes and tax reform. This will be our next step. "
In general, the positive background for stock indices remains. Despite the rollback (in absolute terms), the indices increased significantly in annual terms. So, the S & P500 index, despite weekly losses, since the beginning of the year is gaining 3.8%, DJIA has grown since the beginning of the year by 3.3%.
Now investors will closely follow the next steps of the administration of the US president. The Fed has already made it clear that there will be only two rate hikes this year, i.e. one more, and not three, as planned earlier. The Fed's inclination to soft monetary policy, as well as Trump's statements that the country needs a cheaper dollar, are supporting the US stock market.
Support and resistance levels
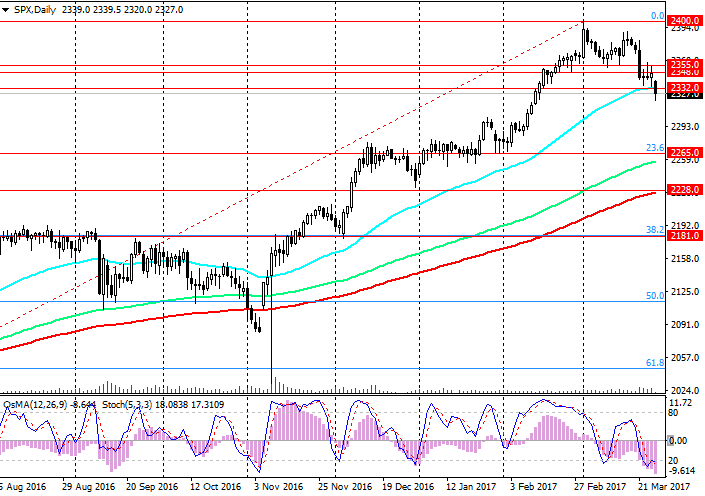
With the opening of today's trading day, the S & P500 index fell sharply. The recall of the bill on health care from the Congress and its withdrawal from the vote collapsed the dollar and major US indices. The S & P500 index broke a short-term support level of 2348.0 and a support level of 2332.0 (EMA50 on the daily chart).
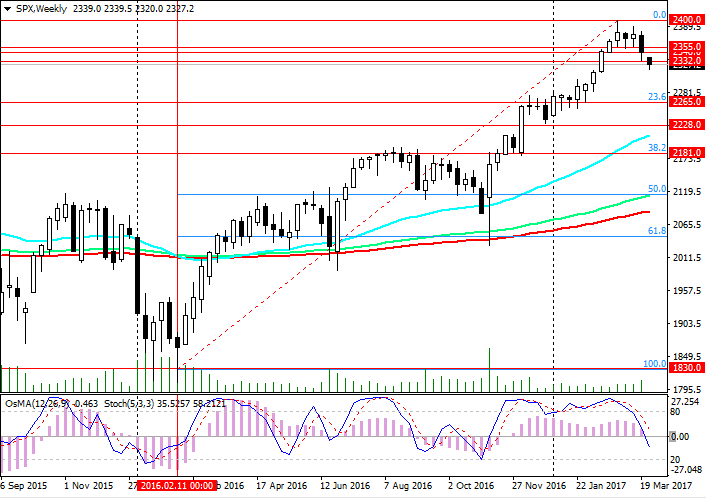
Indicators OsMA and Stochastics on the 4-hour, daily, weekly charts went to the side of sellers.
The breakdown of the 2348.0, 2332.0 levels increased the risk of further decline in the index. The objectives of this decline are the levels of 2258.0 (December highs), 2265.0 (EMA144 on the daily chart and the Fibonacci level of 23.6% correction to the growth of the index from the level of 1830.0 (low of 2016) to the level of 2400.0 (highs of 2017)).
Restoring of the index above the level of 2355.0 return the positive dynamics to index S&P500 and will point to the recent highs near the level of 2400.0.
The breakdown of support levels of 2228.0 (EMA200 on the daily chart), 2181.0 (the Fibonacci level of 38.2%) will cancel the bullish trend of the index.
Support levels: 2320.0, 2265.0, 2228.0, 2181.0
Resistance levels: 2332.0, 2348.0, 2355.0, 2400.0
Trading Scenarios
Sell Stop 2318.0. Stop-Loss 2333.0. Objectives 2265.0, 2228.0, 2181.0
Buy Stop 2333.0. Stop-Loss 2318.0. Objectives 2348.0, 2355.0, 2370.0, 2385.0, 2400.0