This story has begun quite a long time ago. First I developed an indicator which makes it possible to use trading strategies based on volume delta (or market depth) on Forex. It's presented in the blog post "Can we trade Volume Delta on Forex?" Then I published another several products related to the volumes. You may find some details about them, if you follow the links collected in my comment for the abovementioned blogpost. Yet there were still more things to do in this area.
As you may know VolumeDelta indicator shows a table with volume per price clusters for specific bar. And most importantly, the table is attached to a corner of your work chart, making it a bit difficult to set relation between the price scale and the cluster data. This is why it was not surprising that one of popular feature requests was to place the table in sync with the price curve.
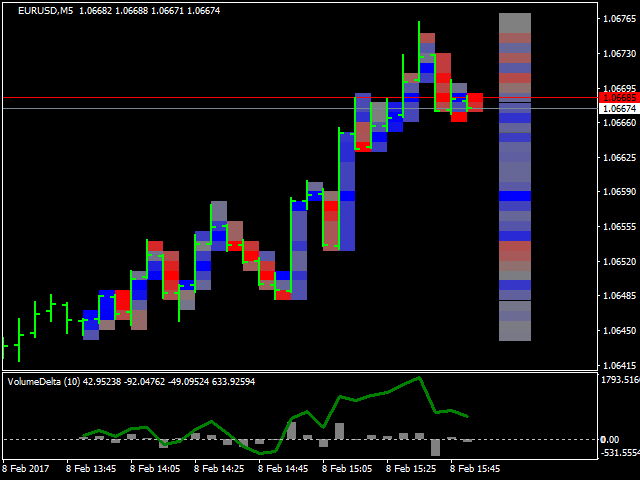
Well, unfortunately it's not possible to squeeze the table into an ordinary bar, or it would be unreadable at least. Can we think of a workaround? Surely we can. I decided to replace the table with a colored heat map, built from small rectangles. Colors denote volume's sign and magnitude, so there is no need to read a lot of numbers. And as far as the rectangles are small, one can draw them for many successive bars, getting the whole picture in retrospective.
Please take a look.

This is a brand new indicator of volume delta footprint. I invite you to test it.
This coin has a downside though. Since the map is just a set of objects, you can't read its data as indicator buffers from an expert adviser. This is a tool for manual trading.
Please, don't forget that my customers are eligible for 20% discount.


