Crude Oil Price Forecast: Evening Star Pattern Turns ST Focus Lower

Crude Oil Price Forecast: Evening Star Pattern Turns ST Focus Lower
Talking Points:
- Crude Oil Technical Strategy: USOIL break from diagonal turns lower to polarity zone 51.50/50.50
- CTFT Commitment of Traders reports shows net longs ended 2016 near record levels
- Rebalancing week in positioning may put further pressure on Oil price
Crude Oil prices have failed to close above $53.80/bbl at the open of the year, and given the pattern we have recently outlined, it is likely best to remain on watch for further short-term downside. The pattern is a rising wedge, which in the market context could either be an ending diagonal, which would favor an aggressive break below $50 followed by further downside or a leading diagonal. A leading diagonal would be the most Bullish outcome for Oil if played out in a traditional manner where a small retracement against the direction of the diagonal is preceded by an aggressive move higher.
The price pattern that has developed with the recent move lower is an Evening Star Pattern, which is a three-candlestick reversal pattern covering Thursday-Monday’s price action. The invalidation of the bearish pattern is a close above middle-bar high on Friday at $54.29. Price action below there would favor further downside toward support mentioned below.
Either way, traders should keep an eye on the $50 level as the price action around here, whether or hold or break could be indicative of whether we will see upside or downside volatility through January. A key article of news worth remembering is the CFTC Commitment of Trader’s data that showed ICE Brent positioning ended the years at record highs with 455k lots while net positioning on NYMEX WTI was ~50k shy of the record at 306k lots.
Looking at the positioning data, it’s fair to say that there will need to be a boost to encourage the Bulls to reload on their positioning to take the market higher or a sharper rebalance/ unwind could develop that may tip the scales for an ending diagonal with a sharper pullback.
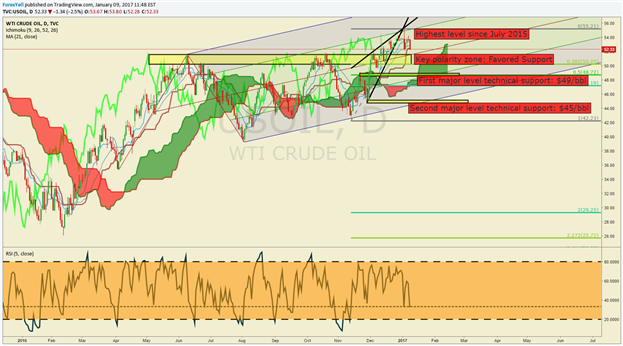
The chart below provides the key downside levels to watch should a stronger breakdown develop. The first major level is the 50% retracement of the December-January rally at ~$49/bbl. The next level to watch is the late November low before confirmation of the OPEC deal hit the wires at ~$45/bbl.
However, a bullish resumption with a hold above $50, and an eventual close above $53.80 would likely favor a strong move higher through January, which would also add to the argument of higher inflation and a likely more aggressive Federal Reserve in the years to come.
D1 Crude Oil Price Chart: Crude Oil Volatility Opens 2017 with Focus Now On Prior Resistance at $51
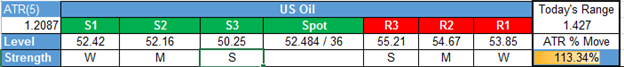
Key Levels Over the Next 48-hrs of Trading as of Monday, January 9, 2017