
Fibonnacci Trading
Fibonacci tools in practice
In this article i would like to write something about fibonacci tools
and probably to show you how to use them in very effective way.
All of us know what are fibonacci numbers so i wont explain
the principle how they work in general meaning but in forex they can be
very usefull. Generaly we can get them by dividing a fibonacci numbers
with another so we get the ratios like this ones :
13/21 = 0.618 * 100 = 61.8%
34/21 = 1,618 * 100 =161,8%
21/88 = 0,382 * 100 = 32,8%
We get these numbers by dividing of many numbers with each other so there are many ways how to get them.
In forex for us are important only some of them. We need some key levels , some key fibonacci ratios :
38.2% , 50% , 61.8% , 78.6% , 127% , 161,8% , 261,8%
Actually the trading with fibonacci numbers is very interesting cause
we can use them alone or with the combination of other indicators or
candles or chart patterns.
For me personally when i use them im using them with the combination
of indicators. Buuuut i will show you both examples . That mean with
usage of formations and with the usage of indicators.
Fibonacci Retracement
We have many fibonacci tools ,... really . In this article i will try
to show them all but for now i would like to discuss ( in my opinion
the most important) fibonacci retracement.
Here we should watch these main levels : 38.2% , 50% , 61.8% and 76.4% of Fibonacci retracemnet. ( if you dont know how to add a new level in Metatrader see the picture 1.)

Picture N1 : Adding of new level in properties of Fibonacci tools
After we have made this adding we should realize one thing . The market
is never going in one direction permanently and after each radical
movement it must typically retrace. Yes you are right the market will
NEVER hit these levels exactly and sometimes it happens that the prize
finish somewhere between them.
How to draw fibonacci retracement CORRECTLY !
Well i think this one is very clear but sometimes we are confused „how to draw the fibonacci retracement. ( Look on the Picture N2 and N3)
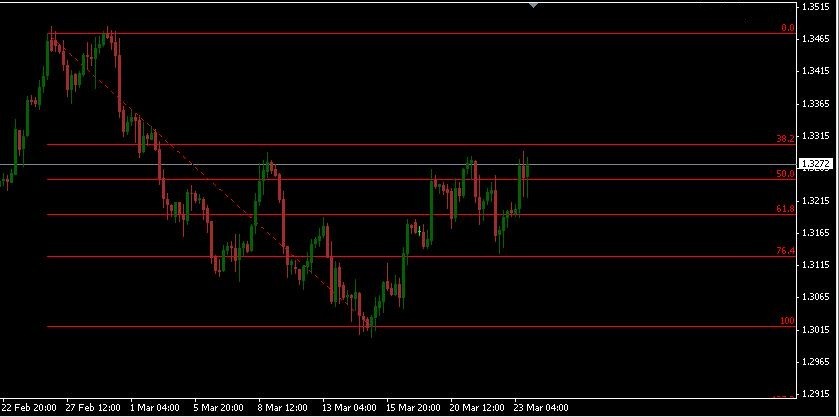
So here on Picture N2 we can see a SELL setup where price is moving from the point A (0.0%) to a swing low at a point B (100,0%) and retrace to point C (61.8%)
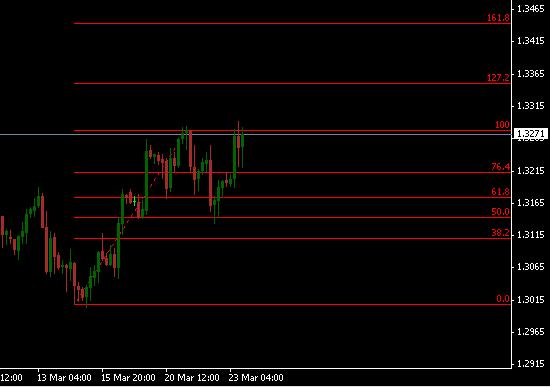
So here on Picture N3 we can see a BUY setup where price is moving from a swing low at point A (0.0%)
to s swing high at point B(100%) and retrace to point C (61.8%)
I would say that drawing of fibonacci retracement should be clear for everyone a trader must be familiar with drawing of them.
What is the meaning of fibonacci retracement for target point ?
Lets say that the target point is point D so according to our previous points there are known general formulas for counting point D . So the retracement point C can be calculated by measuring the number of pips from point A to point B and after that by multiplying by factors like on the table:
Fibonacci Target and formula points C or D
38.2% - (B-A) x 0.382 – B = C
50% - (B-A) x 0.5 –B = C
61.8% - (B-A) x 0.618 – B = C
78.6% - (B-A) x 0.786 – B = C
100% - (B-A) x A +A = D
127% - (B-A) x 1.27 + A = D
161.8% - (B-A) x 1.618 + A = D
200% - (B-A) x B + A = D
261.8% - (B –A) x 2.618 +A = D
But nowadays many trading softwares these extensions have so the
calculations are not needed. But for better understading it was
necessary to show how it could be calculated.
The best way how to know if the price is moving in the direction of the main trend . If the price is moving against the main trend we should watch levels like 38.2% ,50% , 61.8% or 78.6% .
Support and Ressistance lines with the usage of Fibonacci retracement.
The trading with fibonacci tools is very effective but not as
accurate asi t could be with the usage of another instruments. The first
type of combination is trading with S/R lines with the combination of
fibonacci tools (retracement).
The general definition of S/R lines is very easy. They are lines or prices where could be a possible turn of the trend .
So lets put this together . We have S/R lines and Fibo retrecament .
These two instruments will give us an apropriate information for our
decision .
Trading with fibonacci retracement.
Step N1. : Setting of S/R lines:
At the beginning we must decide what sort of trade we are going to
make . That means , long term , mid-term , or short term trading.
According to this we should choose a proper timeframe :
Long term trading : 4H ,D1
Mid term trading : M30 , H1
Short term trading / scalping: M5 , M15
(this division is according to ME and it is my opinion!)
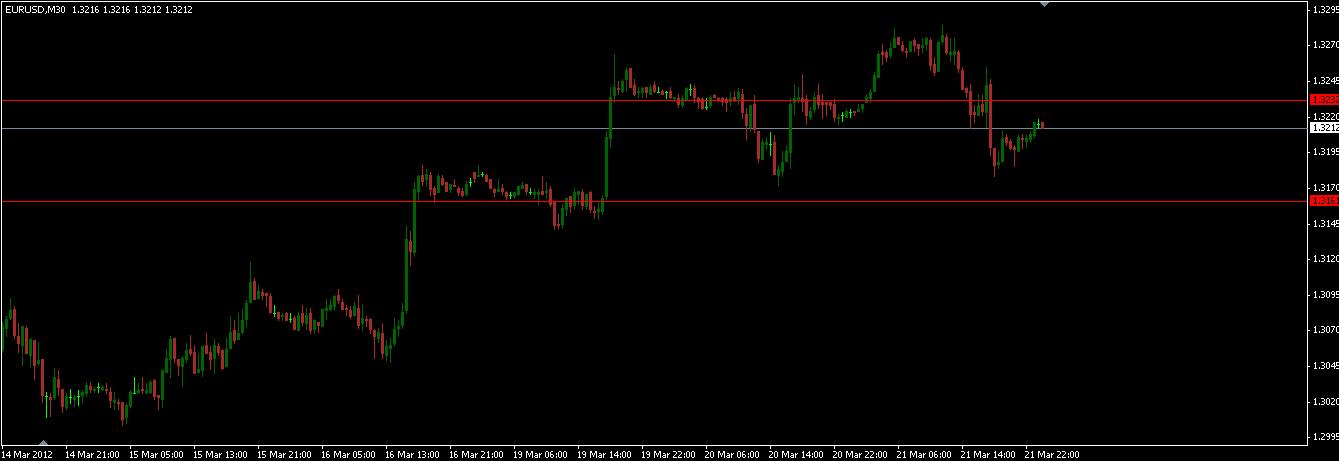
So lets choose the Mid term trading - we must have a general view on the graph .So we must zoom out the graph so we should see something like this
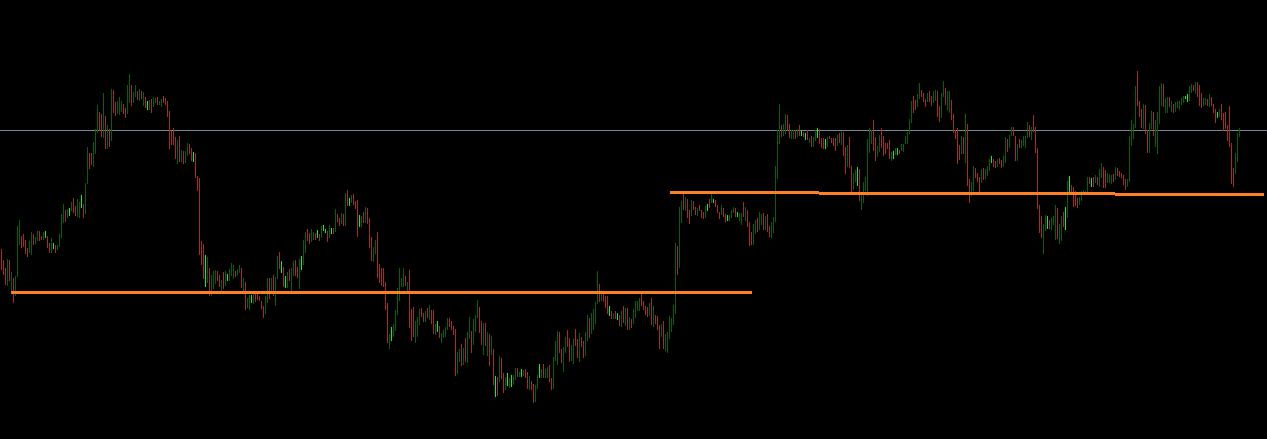
I fully understand that there can be drawn more then these S/R line. think the S/R lines from the Picture are very clear. We can say that
the places where the price hit the S/R line is a place where a
potentional change of trend could happen or already have happened.
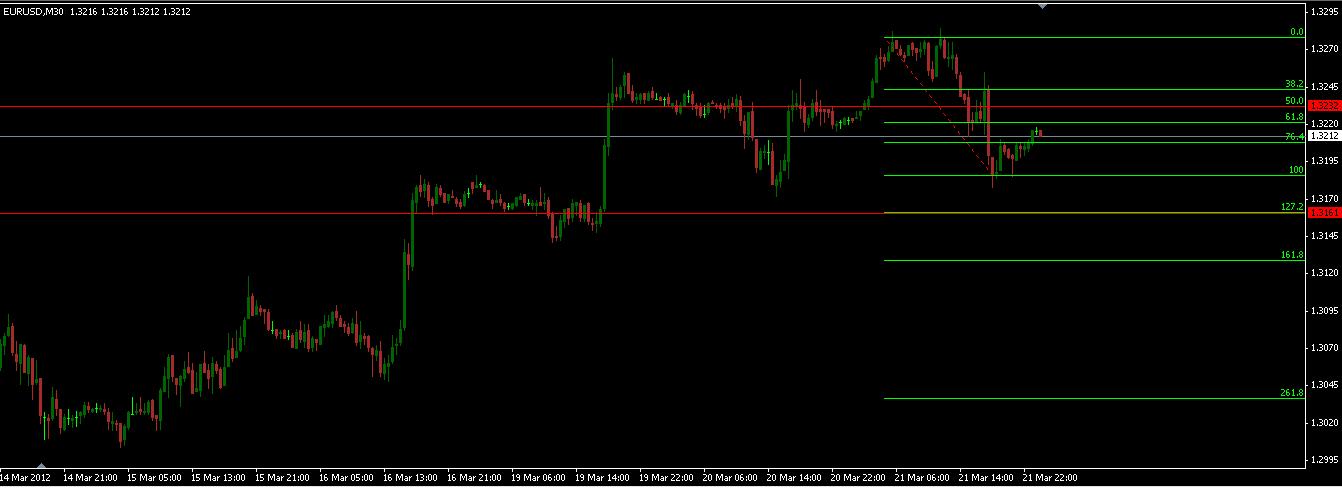
When we have set our S/R lines now we can combine them with our fibonacci retrecament

So as we can see we have the same S/R line (the red lines) and have inserted the fibonacci retracement (the green one) . As we will study the Picture more properly we will see that basic formation of fibonacci retracement is clear. But there is another beatifull point to mention. The levels 61.8% and 161,8% are NEARLY the same as these two levels . Now how can we use this information for u.
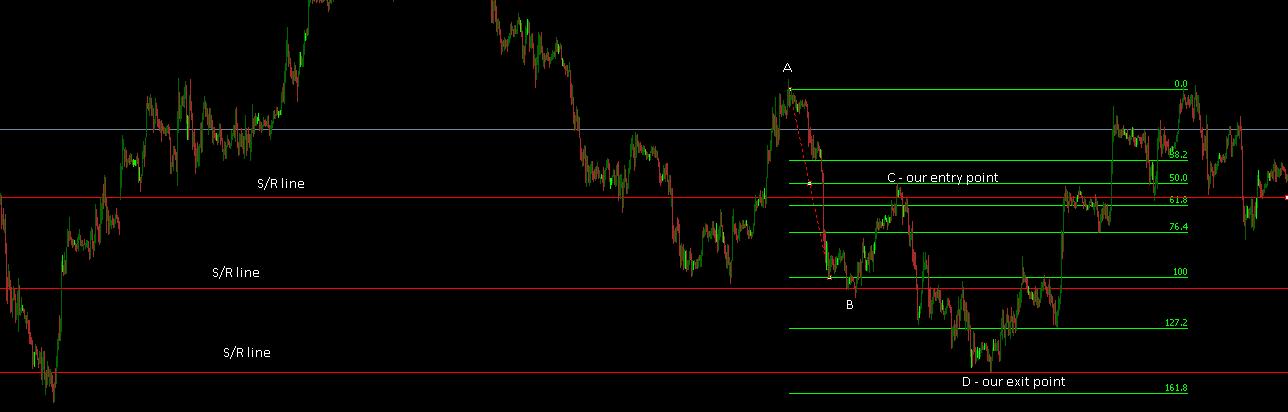
The basic sequence ABCD is clear and it always work for us. We have set
two swings A and B from point B we can make one trade ( if you don’t want
just don’t do that) to the point C which the top SHOULD be logicaly on
the level of 61.8% fibo retre. BUT as we know the market NEVER hit the
levels exactly so what we will do is that we will set our TP on the
level of the S/R line(the red line) which will give us a safe place for
exiting from the trade. After that the market will PROBABLY move
downwars . So we will check the lower time frames to be sure that the
market will fall down and we can prepare for the trade number 2. ( Sometimes it is also good to set trailing stop or moving your SL to secure your profit).
Again the entry point wont be the S/R line because we still
dont know (or we are not still sure ) if the line will act as
a Resistance for the EUR and the price will not continue upwards. That
is why we will set our entry point BELOW the S/R line that means on the
level of 61.8% fibo retre. After that we will watch another levels. It
is up to each trader if he will set the TP on the level 127.2% fibo
retre or lower 161.8%.
But again lets think about it little bit. If we want to set our TP
lower we must set it above the levev of 161.8% . So the value will be
the same as the value of S/R line. As we can see on the picture our TP
would be hit.
Target point and trailing stops
The setting of target point is I think clear . We must always set the TP
also with the help of S/R lines as we can see on the picture. But there
is a still question which levels we should set as our main target
point. Mmmh well each of Fibonacci retracement is in some way important
and also it is very risky to set it higher or deeper as it is a
formation ABCD , because we also have ABCDEF , ABCDEFG etc.
For me personally I have defined all the Fibonacci levels till the
level 261,8% but my decision are dynamic. That means that im deciding
during the trading if I just let it go or will just simply close it. But
lets make a basic and the most safe conclusion from this . USE TRAILING
STOP !
I would say that the usage of trailing stop is very easy. In the case
if you are full time trader and you have the possibility to control and
observe your position you can just set the stop loss and move it as the
position is developing .
That means if our trade is in + pips for example + 50 pips we can secure
with SL the profit of about 25 pips so if there will be some unexpected
huge movement we will still have a profit of about 25 pips.
The combination of S/R lines Fibonacci retracement is very usefull
and effective. I can show you the effectives again on another two
examples
Example of a trade with Fibo retrecament
So we have got here such a situation on EUR/USD M30 graph . As what we have written we will set our S/R lines at first.
We are analyzing the last situation that means tha last downtrend followed by little uptrend and we need to know what will happen next.So the next step is to draw our Fibonacci retracement.
So nice as we can see we have defined S/R lines and fibo retre .
According to this we can see that relevant lines are 50% of fiboretre
where is totally the same our first S/R line and where will be our entry
point to the SELL trade.
The second relevant fibo line is 127.2% where will be our main. TP. Lets see what happened.

So as we can see the price hit our 50% and we have entered to trade. Our TP is clear which is set according to fibo retre and S/R line.
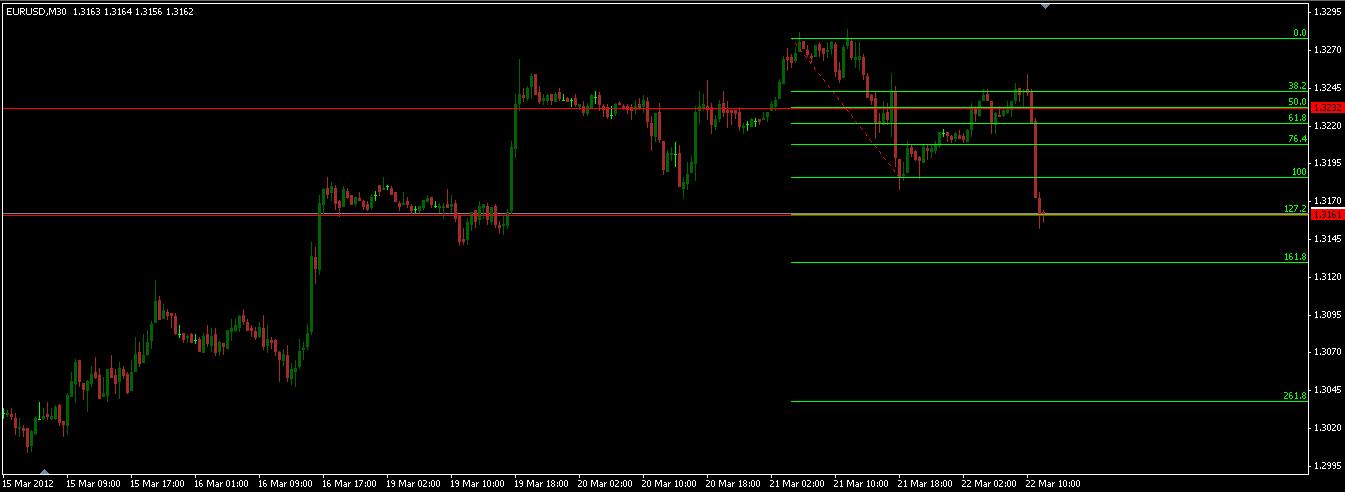
So as you can see our TP has been hit and we take profit. Don’t forget
to set your trailing stop or just move your Stop loss to secure your
profit.
This is only one example so that means you must train and trade a lot
on your demo account. You wont get this to your blood after 5 trades on
demo . We cant say that this method is on 100% reliable but
we can say that from 10 trades 8 will be profitable if and only if your
dedications will be according to some steps .
The success in this case is based on hours of trading on demo account
. After that you will be able to make constant results.
Wish you many green pips !


