Technical Analysis of Gold for July 1, 2016
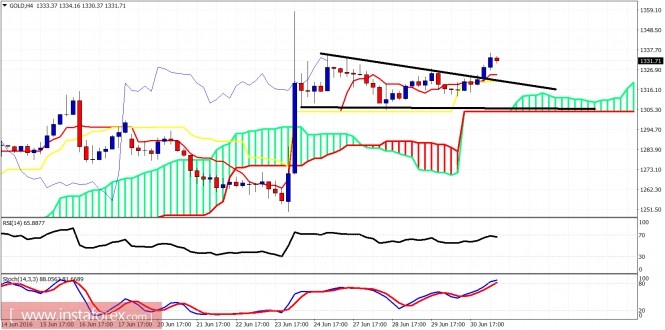
Gold has broken out of the triangle consolidation and is making higher highs and higher lows. The price is heading at least towards the $1,360 high with expectations of breaking it and reaching $1,400 by the end of next week.

Black lines - triangle pattern (broken)
Gold continues to trade above the Ichimoku cloud and, as we said yesterday, the price formation was impulsive and a breakout was very near. Short-term support is at $1,313. Resistance is at $1,340 and next at $1,360. I'm bullish in Gold.

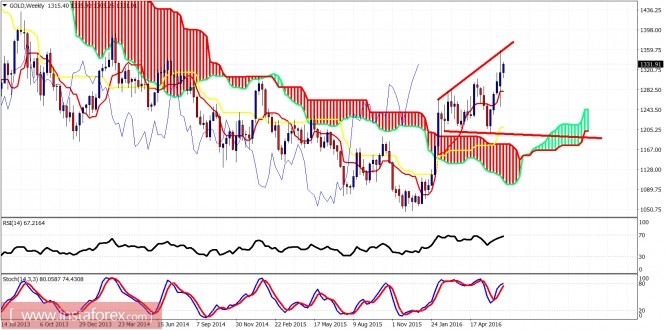
Red lines - expanding triangle
Gold is above the weekly cloud and is approaching post-Brexit levels. I continue to be bullish expecting to see $1,400 by next week. Gold has made a long-term low at $1,045, and I believe we are witnessing the early stages of a bullish long-term reversal.


