Technical Analysis of Gold for April 12, 2016
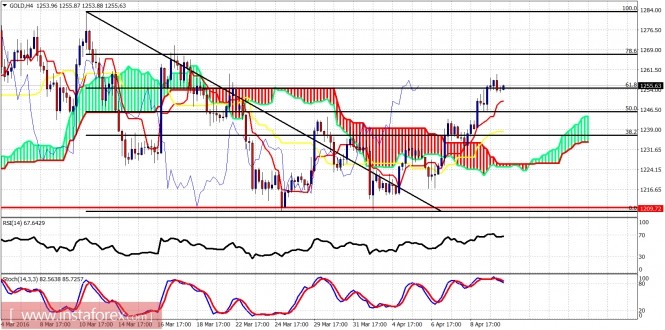
Gold made a new higher high yesterday towards the resistance of the 61.8% Fibonacci retracement and is now trading around this important level. Bulls need to see a continued support of the higher highs and higher lows pattern for new highs near the $1,300-$1,320 area to be seen.

On the 4-hour chart, the stochastic oscillator is giving bearish divergence signals. The price remains above the Kumo (cloud) confirming the short-term trend is bullish. I prefer to be neutral or bearish at the current levels as I believe the scenario with the new high near $1,300 has less chances of success. Support is at $1,247. If broken, we are going to test $1,230-25. Resistance is at $1,260-70.

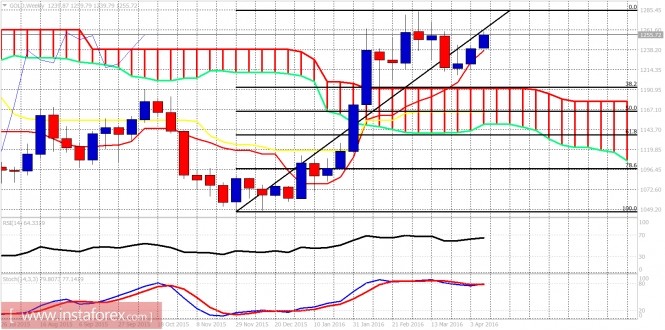
This week has started on a bullish note holding above the weekly Kumo and weekly tenkan-sen (red line indicator). The stochastic is overbought with divergence signals. This is a warning for Gold bulls. My preferred strategy is to be patient and wait for a deep pullback in Gold prices towards $1,150 before opening long positions.
The material has been provided by InstaForex Company - www.instaforex.com


