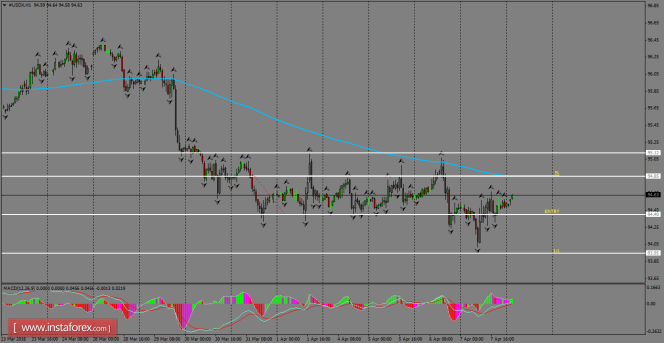
Daily Analysis of USDX for April 08, 2016
USDX is looking to break the sideways structure, which has been developing since the March 30th session. However, it is still trading below the 200 SMA on the H1 chart, so the Index could be looking for new lows in coming days at least. The short-term scenario is calling for a possible re-testing of that moving average, before resuming the bearish bias.

H1 chart's resistance levels: 94.85 / 95.12
H1 chart's support levels: 94.40 / 93.95
Trading recommendations for today: Based on the H1 chart, place sell (short) orders only if the USD Index breaks with a bearish candlestick; the support level is at 94.40, take profit is at 93.95, and stop loss is at 94.85.
The material has been provided by InstaForex Company - www.instaforex.com


