Technical Analysis of USDX for March 30, 2016
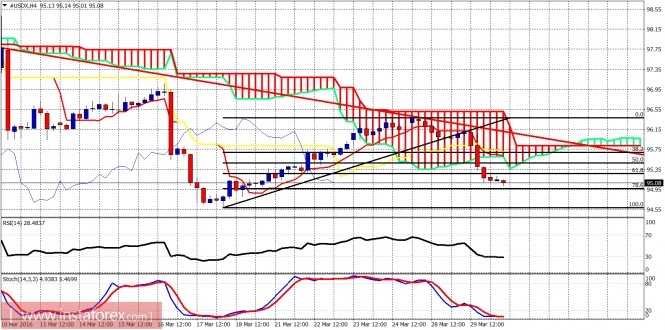
The Dollar index, as expected by our last analysis, has pulled back towards the short-term support at 95. For the last couple of days I've been calling a bearish reversal in the Dollar index and the speech by Fed Chairman Janet Yellen was the cause of such a pullback.

Red line - resistance
As I showed yesterday, the Dollar index was rejected at the downward sloping trend line from 98.60 and with oscillators diverging a pullback was imminent. After Janet Yellen's speech, the Dollar was pressured by sellers, so the index fell heavily towards the 61.8% and 78.6% Fibonacci retracement support levels.

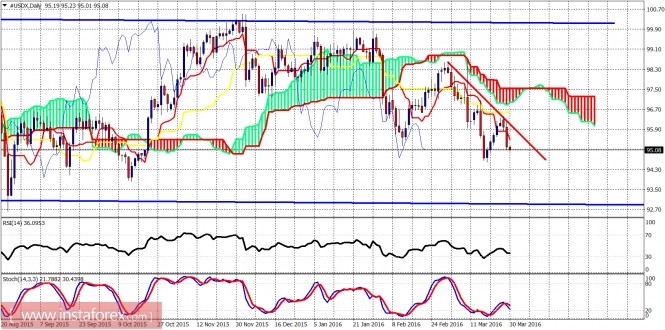
Red line - resistance
Blue lines - trading range
Although the Dollar index is still trapped inside the trading range shown by the blue lines, the short-term trend remains bearish as the price continues to make lower lows and lower highs. The price is still below the Kumo (cloud) resistance. However, I do not see a bullish divergence in the oscillators yet, so a new lower low could be expected. Above 96.40, the short-term trend changes to bullish.
The material has been provided by InstaForex Company - www.instaforex.com


