
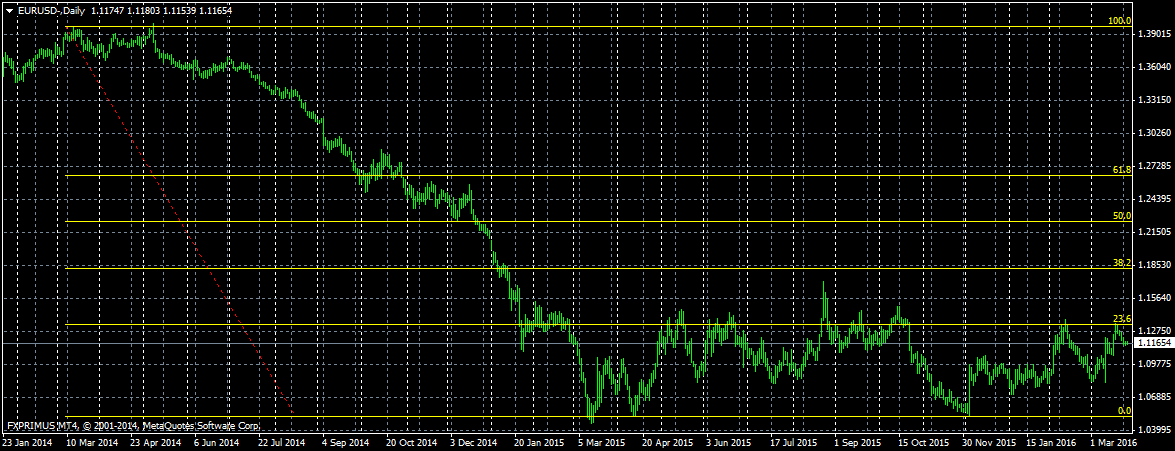
The EUR / USD is going sideways between 1.0450 and 1.1450 since March 2015.
Currently, it is at 1.1165. Not too far from 1.1450. Approximately 285 pips.
As it is moving range bound, traders should keep their eyes on 1.1450 levels where the EUR / USD may find resistance and move lower. The European economy is still weak and there are better chances for this currency pair to go lower.
If we draw a Fibonacci Retracement line from 1.3967 (March high 2014) to 1.0517 (November low 2015) then we can see that current price 1.1165 is very close to 23.6%. Means, it will find its first resistance at this level. In a range bound price action, traders should always sit on the sideways until it hits the top or bottom. In this case, it has a little more room to go higher before finding the strong resistance at 1.1450.
There are some important news coming up next week (March 28 – April 1) for this currency pair. So, watch for those news. Most importantly, German Unemployment report and Eurozone March Consumer Price Index. These two news will give some clue about the Euro Economy. Germany as being the biggest economy, there un-employment report matters for the Eurozone. Expect some volatility after these news.
Trade with logic, not with emotion.
Happy Trading


