

Price action analysis is a form of technical analysis involved with analyzing price, and price alone.
Traders can use price action to determine trends and grade market conditions.
Traders can adjust their approach to match the right strategy with the right condition.
In this article, we’re going to attempt to show traders how they can look to define market condition with the study of price action so that they can, in-turn, decide on which types of strategies or systems to use in their approach to that particular type of market.
The Importance of ‘Condition-Identification’
Imagine that the Euro-dollar has just dropped 250 pips over the past 4 hours. Do you buy? Do you sell? Do you stay flat?
While we can get a range of different answers from any group of traders, there isn’t a ‘right’ answer that exists. The only way to begin moving towards delivering an answer to this question is to ask another, perhaps more important question: Which condition is this market displaying?
Because if that 250-pip sell-off brought prices right down to support, only to see support be respected as buyers enter the market; then we may be seeing a range; in which case buying could certainly be attractive.
Or perhaps this 250 pip drop just led to a further drop, alluding to the possibility of a breakout-continuation move? If this is the case, you would want to be looking to get short – not long.
What we’re referring to here is condition being displayed by the market, and there are 3 possibilities of what can be seen; and the type of condition that the market is displaying can massively impact the way that a trader would want to go about trading in that environment.
These types of conditions will display themselves on all time frames in pretty much every free market on the planet based on how traders, investors, and fund managers are approaching that particular environment.
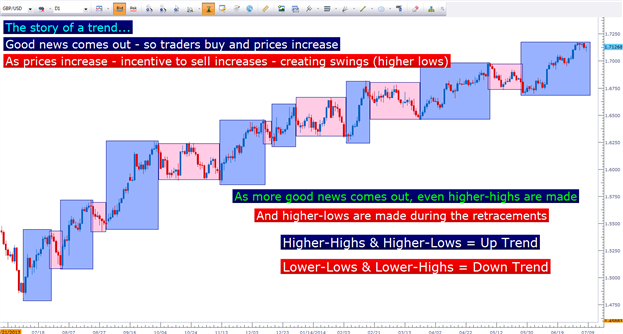
Say something good has happened recently… and right now, the UK can be a great example of this, as fundamental data has been showing steady improvement to the point where analysts are beginning to project interest rate hikes in the not-too-distant future.
Well, as this data has become more and more positive - more and more investors have wanted to buy GBP. After all, if rates increase, rollover payments can increase as well; which means that even more people would want to buy to capture that new higher rate.
But rather than wait around for a rate increase, investors begin buying Sterling far before that road is ever crossed, and prices begin to move higher to go along with this increased demand. This is when the market will show higher-highs and higher-lows.
Because it’s not a given that rates are going up in the UK; at this point its only theoretical because data has been getting better and better. So rather than the market shooting straight-up, it makes a ‘two steps forward, one step back’ type of motion as prices swing progressively higher.
The Year-Long Trend in GBPUSD has moved up over +2200 pips
Eventually, anyone that wanted to buy Sterling with the given news has
already done so. Combine this with the fact that the GBP is now trading
at higher prices (more expensively) to factor in this newfound hope of
higher rates, and demand begins to slow at as prices increase further.
Not only that but traders that had bought GBP before the news started
getting brighter are now sitting on a profit in the position, and they
may be looking to take some profits for fear of a reversal.
This is what creates a retracement in the trend: A lack of additional
motivation to move prices in the trend-side direction combined with
profit taking.
But after prices move low enough, buyers begin to get attracted again…
after all, prices went up for a reason, right? The hopes of higher rates
still exist in the market, only prices had run so far so fast that few
investors wanted to chase the move by buying at highs… but now with
prices moving down to a support level, GBP can begin to get attractive
again.
And as prices move back towards their previous high (the swing-point at
which prices had come down after the last run-up), long position-holders
may look to take profits, yet again. And after prices move down to
support, the pair becomes attractive and buyers enter… again. And once
price gets back to resistance, selling can ensue, yet again.
This is the range-bound market condition, and this is what takes place
when there is roughly equal buying and selling demand on each side of
the trade. This can often happen after a bout of good news as the market
awaits something else. A great example of a market currently displaying
this posture is USDJPY.
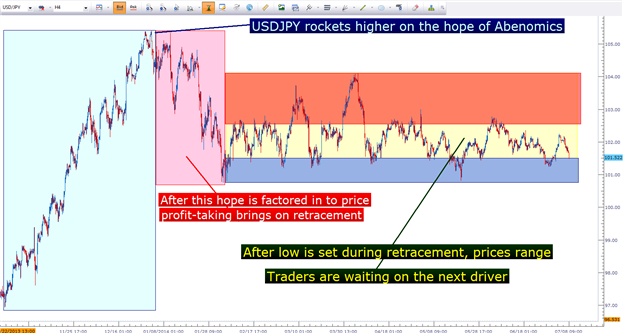
After USDJPY moved up on the hope of ‘Abenomics,’ investors have been
waiting to see whether the plan is successful and will promote inflation
in Japan, or whether the entire thing will fail; watching the USDJPY
get back down to the 80 level with which most Japanese exporters will
suffer.
USDJPY has been in a range for 5+ months as traders await the next ‘driver’ in the market
While we can’t predict what’s going to happen in Japan, or in the USDJPY
– what we can project is that something eventually will change. If
Abenomics works, we can see the JPY continuing to weaken all the way to
the 120.00 level; or if the world faces another round of economic pain,
the JPY may strengthen towards 80.00.
But when the range in USDJPY does eventually break that will lead to our
third market condition which is probably the most difficult to wrangle;
and that is the breakout.
The breakout market condition takes place when support or resistance is
broken as new highs or lows are traded. This is a difficult condition
because as these new highs or lows are made, an increase in volatility
will often accompany the move. And this increase in volatility isn’t
necessarily a ‘good’ thing, as it simply means that there is heavier
risk on both sides of the trade; meaning, reversals can be painful if
you’re caught on the wrong side of the move.
Further to this point: Many breakouts fail. Many times we’ll see prices
break support or resistance only to reverse shortly thereafter. So while
trend traders may look for a 40-50% success rate, and range traders
looking for 50-60% success; breakout traders are often dealing with
20-30% winning percentages.
Well – why would anyone want to trade breakouts if they might only win 20 or 30% of the time?
Many traders flock to breakouts and breakout-conditions for a couple of
reasons. I think the most common reason is excitement. When new highs or
lows are made in a market, it grabs attention. Its ‘news-worthy’ events
that create or cause breakouts, and most new traders want to be
involved in those environments.
But another big reason that many traders are attracted to breakouts is
the perceived up-side potential. Most new traders go into trades or
positions only thinking about the positive possibilities; with less
regards for the risk involved. But the fact of the matter is that risk
and possible reward always go hand-in-hand; so if the up-side of a
potential breakout is ‘huge,’ so is its risk.
This isn’t to say that breakouts can’t be traded, because they can. But
caution should be used whilst doing so, and strong risk management is a
necessity for managing a strategy in this type of environment.
How to Use Price Action to Determine the Market’s Condition
This is going to be surprisingly simple.
Because breakouts come from ranges; and further because breakouts are
impossible to predict, there’s really only two different types of market
environments that we might be able to trade and analyze; and there’s
really just one question to ask yourself to determine which.
That question is:
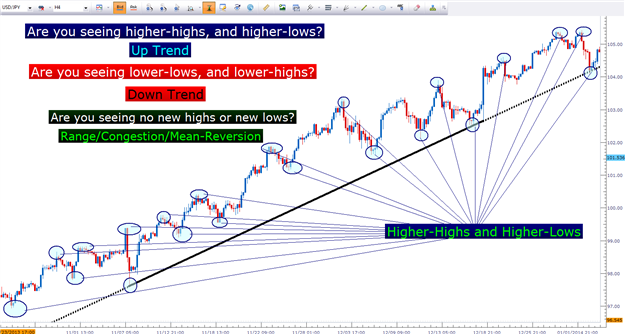
Is this market making higher-highs and higher-lows? Or in the case of a
down-trend, is this market making lower-lows, and lower-highs?
That’s it.
If you’re seeing higher-highs and higher-lows, or lower-lows and lower-highs – then you are witnessing a trend.
The beauty of the up-ward biased gyrations in price action during a strong trend
If you’re seeing a trend, then your outlook in that market should be
biased in the direction of that trend. This isn’t to say that a direct
counter-trend trading approach can’t be profitable; but rather – markets
are always going to be unpredictable and the simple act of witnessing a
trend means that you may be able to get the probabilities on your side,
if even by just a little bit, by trading in the direction of that
trend.
On the other hand, if you’re seeing price action bound by previously
established support and resistance levels – much like the USDJPY is as
of right now, then you’re seeing a range-bound environment. Not all
range-bound environments are going to be as well-defined as what we’re
currently seeing in USDJPY, but if prices are bound between
previously-established support and resistance that is the condition
being displayed.
When you see a range-bound environment, you have another question to ask yourself:
Do you want to trade the range-continuation, or do you want to trade the breakout?
There are two ways to attack the range…
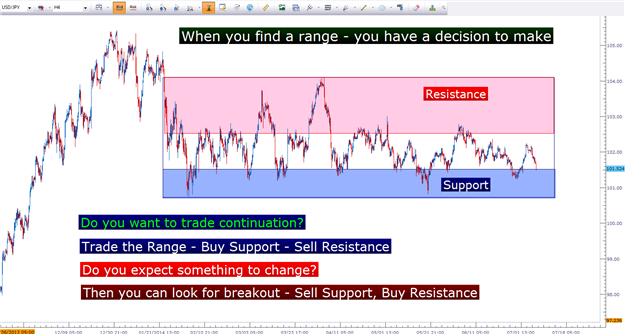
The answer to this question is going to determine all of the details
around the approach. If you’re trading the continuation, you’re looking
to sell resistance, and buy support. But if you’re looking for the
breakout, you’re looking to do the exact opposite by buying resistance
and selling support (in anticipation of the breakout continuing).
Further – the answer to that question is going to determine the size of
the position, the size of the stop and the risk parameters to be used,
and how the trade is going to be managed.
Which Time Frame is the ‘Right’ Time Frame
After learning to grade trends and market conditions, the next operable question is ‘which time frame should I use?’
Unfortunately, there is no ‘right’ answer.
With chart time frames – you can end up chasing your own tail by
watching too many time frames. Perhaps you’re seeing a range on the
daily chart but down-trend on the 4-hour but a screaming up-trend on the
15-minute chart (a retracement in the 4-hour downtrend)? Which one is
going to offer the better trade?
It’s impossible to know until after the trade has been placed – so
rather than trying to watch every popular time frame, the best advice is
for the trader to build their analysis around time frames suited to
their style or strategy. An easy way to look at this is the concept of
‘desired holding time.’
If you’re looking to day-trade, you should do trend and condition
analysis on a shorter time frame, such as the hourly or four-hour
charts… while traders looking to hold trades for a few months
(long-term), shouldn’t even think of the hourly chart; instead focusing
on the daily, weekly, and monthly time frames.


