

1
1 590
The price is breaking descending/bear triangle pattern from above to below for 1.4983 as the next bearish target which will be broken by the price to below on the way of good bearish breakdown, as stated by Skandinaviska Enskilda Banken (SEB).
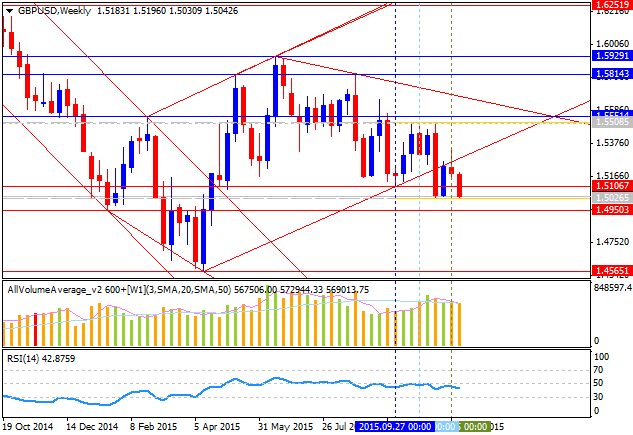
As we see from the chart above - the price is on bearish market condition located to be below 100 period SMA (100 SMA) and 200 period SMA (200 SMA) for the ranging within the following key support/resistance levels:
- 1.5508 resistance level, and
- 1.4565 support level.
RSI indicator is estimating the bearish market condition to be continuing.
- If the price will break 1.5508
resistance level so the local uptrend as the secondary market rally
will be started with a good possibility to the bullish reversal of the
price movement.
- if price will break 1.4565 support so the bearish trend will be continuing.
- if not so the price will be ranging within the levels.


