INTRODUCTION
I’m going to do this very first post about a subject that I really love, that is, technical indicators to analyze the market, specifically the Cycle Period Indicator which was introduced by John Ehlers. For me, Cycle Period is the main indicator, the one we need to understand in order to adapt any other indicator to the market conditions.
It’s not my intention to develop how to program this indicator or how to make the math. In fact, I think that no one else can explain this issue better than John Ehlers himself. So you can check his books out on Amazon. Or you can get the algorithm for Metatrader5. What I’m gonna cover in here are examples about what it does and how it does it, just after a brief explanation about cycles.
CYCLES
First at all, let me copy-paste what John Ehlers says about the cycles. “The dictionary definition of a cycle is that it is ‘an interval or space of time in which is completed one round of events or phenomena that recur regularly and in the same sequence.’ In the market, we consider a classic cycle exists when the price starts low, rises smoothly to a high over a length of time, and then smoothly falls back to the original price over the same length of time. The time required to complete the cycle is called the period of the cycle, or the cycle length. Cycles certainly exist in the market. Many times they are justified on the basis of fundamental considerations. The clearest is the seasonal change for agricultural prices (lowest at harvest)…”
Figure_1
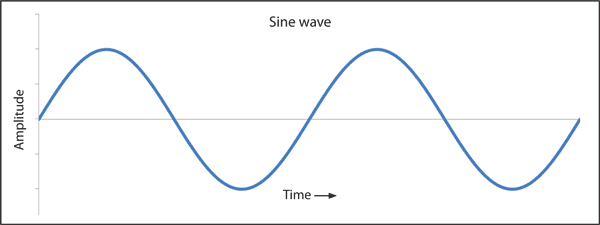
Cycles can vary heavily in the market, and we can feel it even more when we deal with short time lapses like minutes or hours. The cycle parameters are frequency, phase and amplitude and we will be considering the parts of a cycle with the wave represented as a transverse wave as in the Figure_2. Remember that a wave is an oscillation and it represents a repetitive variation through time of some measure about a central value, so for what I try to explain I’ll use cycle and wave indistinctly.
Figure_2
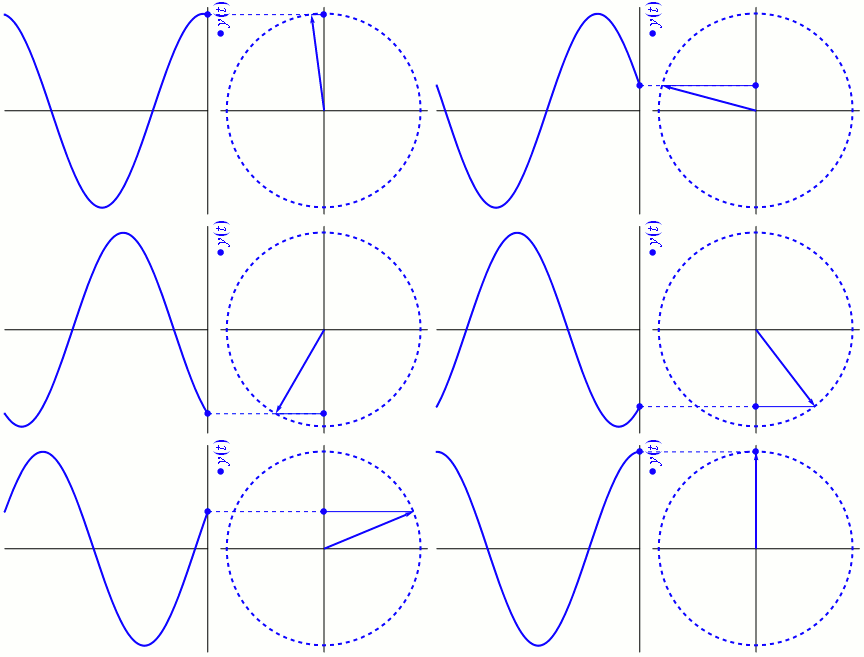
We will picture a cycle as being generated by a vector rotating counterclockwise. This vector is called a phasor. The cycle is complete when the tip of the phasor has completed a full rotation to the origin.
Figure_3
FREQUENCY
Frequency refers to how many waves are made per time interval. This is usually described as how many waves are made per second, or as cycles per second. Besides, the period of the cycle is the reciprocal of its frequency. In trading, we commonly refer to cycles in terms of their period rather than their frequency. For example, the frequency of a 10-day cycle is 0.1 cycles per day. (MESA)
Frequency is a uniquely singular measurable parameter of a cycle. A simple sinewave can have only one frequency. A sinewave is a primitive because we can add sinewaves of different frequencies, phases and amplitudes to create complex wave shapes. (MESA)
PHASE
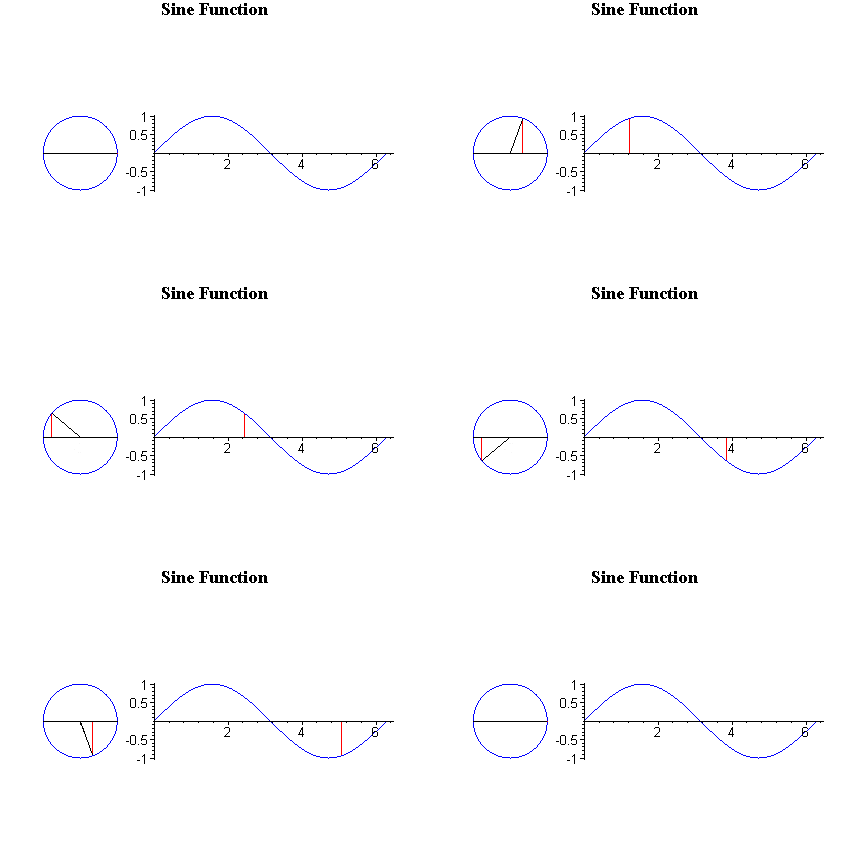
The relationship between the phasor and the sinewave is shown in Figure_4. At time zero the phasor is pointed to the right and the sinewave amplitude is zero. The phasor rotates counterclockwise, so the sinewave rise toward a positive maximum as time progresses. The maximum is reached, the phasor rotation carries to 180 degrees (opposite) relative to the origin. The cycle continues to be drawn as the phasor rotates counterclockwise, and continues cycle after cycle. (MESA)
Figure_4
AMPLITUDE
Its most general definition is that the amplitude is the maximum positive displacement from the undisturbed position of the medium to the top of a crest. This is shown in the following diagram:
Figure_5
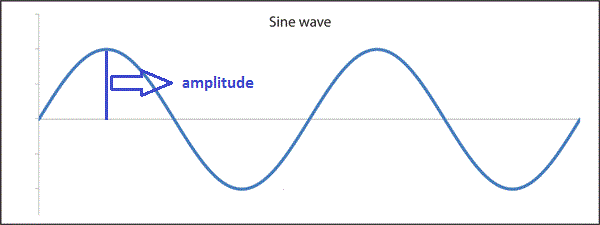
Amplitude is the strength, or power, of the cycle. Power is independent of frequency and phase. It is important to note that the power of a cycle is proportional to the square of its wave amplitude. If one wave is 1.414 (square root of 2) times larger than another, this wave will have twice the power. (MESA)
Power can vary over a wide range, and we often want to look at the low-amplitude signals at the same time that we look at the high-amplitude signals. One way to do this is to look at the power of the signals on a logarithmic scale to achieve the amplitude compression. If we take a given power as a reference, then a signal having twice the power has a logarithmic ratio of 0.3. A signal power four times larger has a logarithmic ratio of 0.6, twice the value of the previous ratio. When the signal power is 10 times larger, the logarithmic ratio is 1.0. The numbers repeat for each tenfold increase in power. For example, the logarithmic of 20 is 1.3. (MESA)
Power is often expressed in terms of decibels (dB). The bel is named after Alexander Graham Bell for the research he performed on audio power to help the deaf. A bel is just the logarithm of a power ratio. Deci- is the prefix meaning one-tenth. Therefore, a decibel is one-tenth of the logarithm of a power ratio. (MESA)
- Power ratio of 0.5 is log(0.5)/0.1 = -3 dB
- Power ratio of 0.01 is log(0.01)/0.1 = -20 dB
- Power ratio of 2 is log(2)/0.1 = 3 dB
- Power ratio of 4 is log(4)/0.1 = 6 dB
CYCLE PERIOD INDICATOR. Let’s the experiments begin
As the name of the indicator suggest, we will be measuring cycles through time in the market prices. But first, in order to be sure about how the indicator works, I’m gonna use a sinewave as a primitive to test the results instead of using market data. I’ll develop several examples modifying the sinewave curve to see how the cycle period indicator response and why. When I say that we’re going to measure cycles I meant to get the dominant cycle period, that is, how many bars takes the predominant cycle in the market data to be formed. Let’s start building a sinewave with a specific period chosen by yourself, and then, we will analyze it using the cycle period indicator to see whether we get the same period as a result. Commonly all over the Web you will see that the cycle period indicator takes just one parameter, that is, an initial alpha related to the length of a simple moving average and in turn this length should be between 6 and 63 bars, which is the cycle range that the indicator will detect, but that’s the point, we can play with that range too. There is a very good implementation of the cycle period indicator on mql5 in the following link, check it out but don't get out your mind trying to understand all the code, just pay attention to these lines:
//+----------------------------------------------+
//| Indicator input parameters |
//+----------------------------------------------+
input double Alpha=0.07; // Indicator ratio
...
DeltaPhase[bar0]=MathMax(0.1,DeltaPhase[bar0]);
DeltaPhase[bar0]=MathMin(1.1,DeltaPhase[bar0]);
//+----------------------------------------------+
//| Indicator input parameters |
//+----------------------------------------------+
input double Alpha=0.07; // Indicator ratio
input double DeltaPhaseMax=0.1; // Max Period in Radians
input double DeltaPhaseMin=1.1; // Min Period in Radians
...
DeltaPhase[bar0]=MathMax(DeltaPhaseMax,DeltaPhase[bar0]);
DeltaPhase[bar0]=MathMin(DeltaPhaseMin,DeltaPhase[bar0]);
Then, as I mention before we'll have three parameters in our cycle period indicator. The first one is an alpha number related to the length of a simple moving average (SMA) by the equation α = 2/(Length+1), this way, if we assume a 28-bars SMA then we got alpha = 2/(28+1) equal to 0.0689, that is about 0.07. Don’t worry and be patience, all this will make sense when we see the first examples.
The next two parameters are related to internal variable called DeltaPhase which will restrict the cycle range, each value is expressed in radians, so if we have DeltaPhase between <0.1, 1.1> radians, that means 2*PI / 0.1 = 62.83 (63 bars) and 2*PI / 1.1 = 5.71 (6 bars). This way, our cycle range to detect is between 6 and 63 bars length. Therefore, we can calculate the radians if we do the opposite operation. Let’s say that we want to detect cycles between 30 and 80 bars, then we just calculate 2*PI / 30 = 0.20 radians and 2*PI / 80 = 0.078 radians.
Now that we know how to calculate the parameters of the Cycle Period indicator, let’s start the first experiment with the default values, that is, alpha equal to 0.07 meaning 28-bars SMA, and DeltaPhase between <0.1, 1.1> radians, meaning cycle range between 6 and 63 bars length. And we will apply it on a sinewave with a period length of 28-bars.
Figure_6
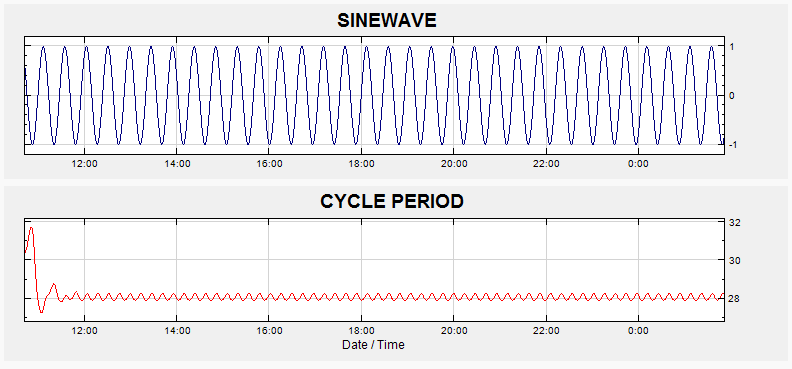
Very nice hah! Don’t you think?!?!?
Ok, let’s make things a little more interesting and let’s increase and decrease the period of the sinewave until 48-bars and bringing it back to 28-bars
Figure_7
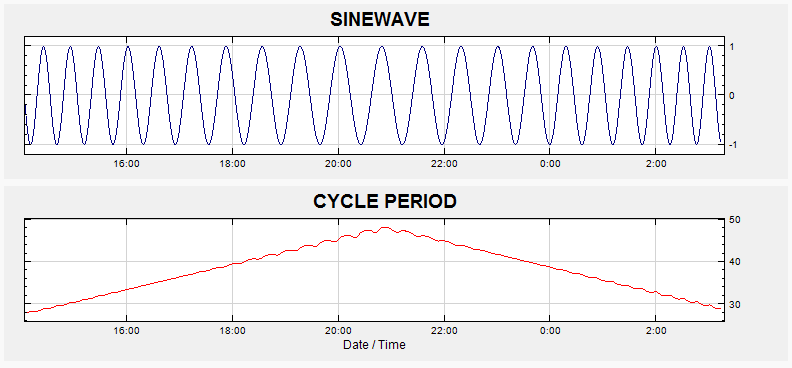
You can see how the Cycle Period Indicator follows rapidly the changes on the curve.
Well, now I got a thought to share, the thing is that as you can see the alpha parameter is more or less in the middle of the range, approximately I mean. I haven’t seen that John Ehler explicitly says: that’s how it must be done, but in my experience it is. If you want to measure a different period range then the alpha parameter must be more or less in the middle of that range.
How do you know that you need a larger range in your cycle period parameters?? When you have a flat line either at the top or the bottom of the cycle period chart just where the range needs to be expanded. In order to check this out, we are going to increase the period of the sinewave from 28-bars to 48-bars per cycle, adding a constraint in the range we're measuring till to 35 recalculating the first value of the DeltaPhase’s range as follow 2*PI / 35 bars = 0.18, so now we have DeltaPhase between <0.18, 1.1>
Figure_8
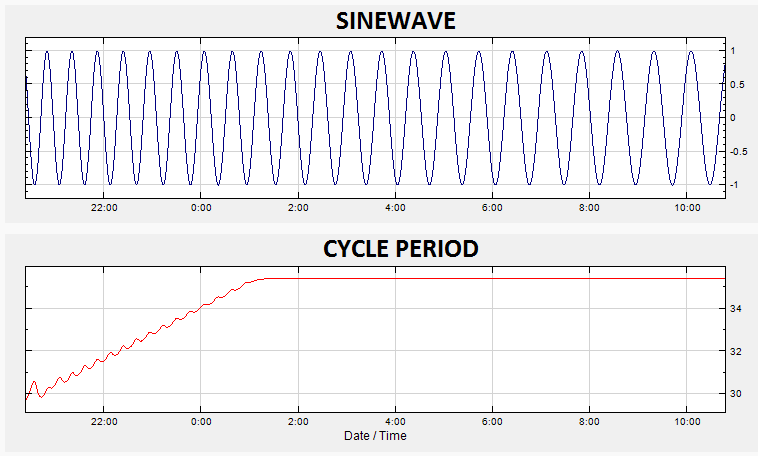
As you can see, the Cycle Period Indicator is not able to identify the higher periods due to the constraint. This should trigger an alarm about the range manipulated by the indicator, even more in market data where the entropy does not allow this kind of scenario because you’re not gonna find an steady period too much forward. So let’s do the things right and get back to the original setup working with DeltaPhase between <0.1, 1.1> radians.
Figure_9
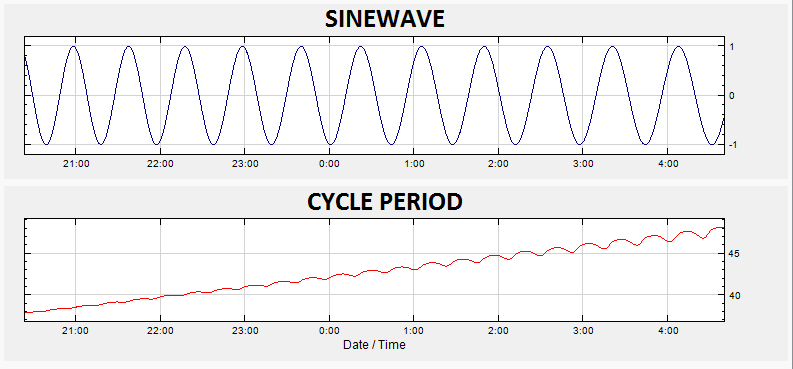
For the record, remember that every single point in the Cycle Period Indicator is called The Dominant Cycle of the curve at that very moment. So far we have been dealing with an ideal curve which is the sinewave and it’s kind of obvious what is happening in here, but on market data, calculating the Dominant Cycle becomes not only an excellent tool, it becomes a must because if we know the Dominant Cycle in any moment, we’ll be able to surf the tops and bottoms of the wave. In fact, John Ehlers has built some others indicators above this one to achieve that goal, but that is another post.

