

Goldman Sachs made a forecast for S&P 500 to finish the year at 2000 with the following explanation:
- "Our baseline forecast is that the US economy will grow at a modest
pace, earnings will rise, and the S&P 500 index will climb slowly
while the P/E multiple declines as interest rates rise."
- "Flat is the new up’ will be the 2016 investor refrain."
On the other hand, Credit Suisse provided a littler more explanation of the situation:
- "We have been looking for the market to retest the spike low from August at 1,867, and then medium-term support at 1,820, the October 2014 low. With several key sectors now also falling to major support levels – notably industrials ‒ and looking vulnerable, we think the risk a major top may be established has risen sharply. Below 1,867 should keep the risk lower for price and "neckline" support at 1,832/20. Below here would mark the completion of an important top, turning the core trend bearish. If achieved, we would target 1,738/30 initially – the low for 2014 itself, and the 38.2% retracement of the 2011/2015 uptrend. Although we would expect this to hold at first, a break would be favoured in due course for 1,575/74 – the 38.2% retracement of the entire 2009/2015 bull market."
- "We've obviously already had a significant fall in the stock market,
triggered by the breaking down of the lows we saw earlier this year. The
big question now is whether this is just a correction in a bull market."
Let's evaluate this situation from the technical points of view.
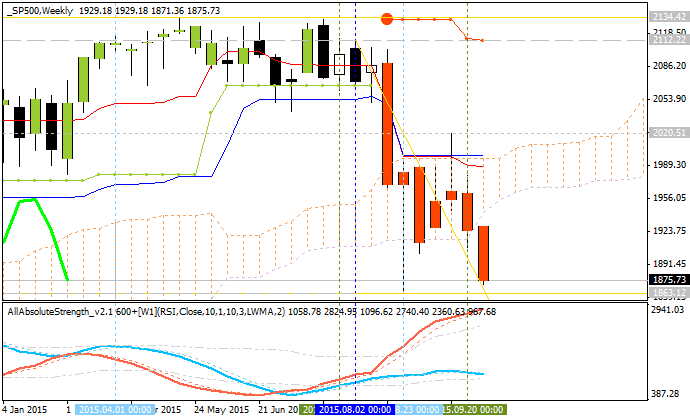
Ichimoku analysis.
Weekly price is on bearish market
condition for the breakdown which was started in the middle of Augist this year: the price crossed Ichimoku cloud from above to below and came to the bearish area of the weekly chart. The nearest support level to be broken for the bearish trend to be continuing is 1863.12, and as we see from the chart below - this level will likely be a broken by the price soon or later.
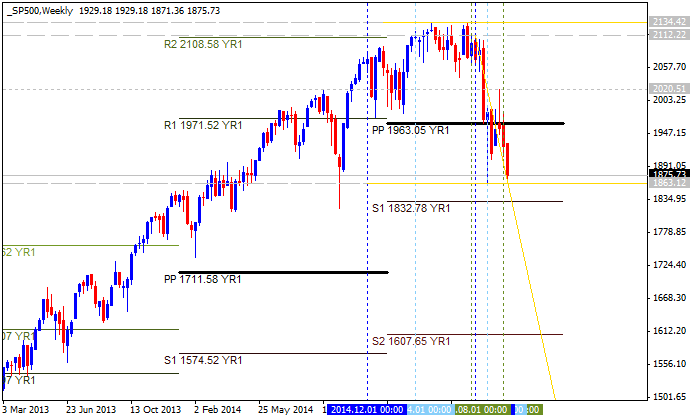
Pivot
Points.
The price broke Central Pivot at 1963.05 for the primary bearish market condition with S1 Pivot at 1832.78 as a next bearish target. If this pivot support level is broken so the next real target is S2 Pivot at 1607.65.
| Instrument | S2 Pivot | S1 Pivot | Yearly PP | R1 Pivot |
|---|---|---|---|---|
| S&P 500 |
1607.65 | 1832.78 |
1963.05 |
2188.18 |


