

Earlier today, Callum Thomas, investment strategist at AMP Capital, had a courtesy to remind us why now it is the perfect time for investors to buy.
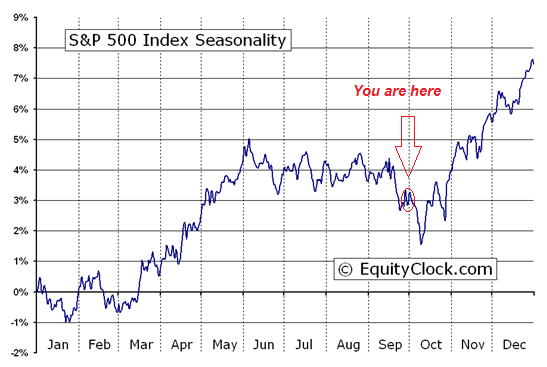
Historically, the three weakest weeks for the S&P 500 Index and the TSX Composite Index are from the last week in September to the second week in October.
On
average, both indexes dipped 2.3 per cent per period during the past
20 periods.
The softest week during the three-week period was the last week in September when the S&P 500 Index fell in 34 periods out of 50 for an average decline of 0.84 per cent per period.
Why is that?
This softness usually follows “quadruple witching,” when sophisticated investors are repositioning listed options, futures and equities following expiry of September derivative contracts. Positions unexpectedly put to investors on derivative expiry frequently are sold, adding to downside pressure just after quadruple witching.
Another reason for the drop is the start of “earnings confession” season when a firm realizes that it will not meet third-quarter revenue and earnings guidance. Bad surprises on the pre-release of third quarter results have a direct impact on shares of the announcing companies.
But the most prominent reason is that analysts begin to launch earnings and revenue estimates for the following year. Analysts often realize that their estimates for the
current year are too high based on projection for next year and they lower their third and fourth quarter estimates, which in turn contribute to the selling pressure.


