USDJPY Weekly Outlook - symmetric triangle pattern and key Fibo levels
3 August 2015, 18:11

2
1 410
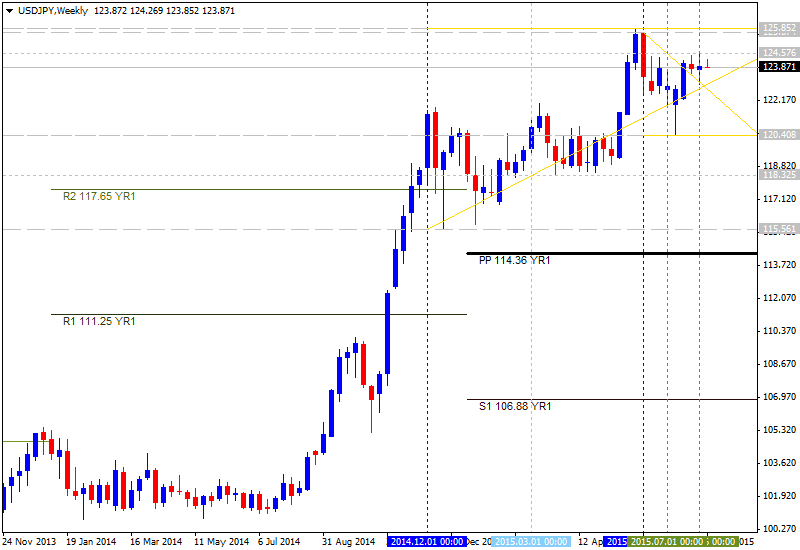
W1 price is located above 200 period SMA (200-SMA) and 100 period SMA (100-SMA) with the primary bullish for secondary ranging between Fibo resistance level at 125.85 and 23.6% Fibo support level at 119.93:
- symmetric triangle pattern is going to be crossed by the price from below to above for the bullish trend to be continuing;
- “USDJPY ended up trading to 125.85 (the mentioned 125.72 was the December range x .618 + the December high…basically a Fibonacci range expansion). Failure at long term uptrend resistance indicates potential for an important top to form. There are 2 days left in June and USDJPY is little changed for the month (month open is 124.10). In other words, a monthly doji could form…at a 20 year trendline (former support…may provide resistance now)!”;
- “A USDJPY breakout from the 6 month coil would open up 123.16-124.13 (high close from June 2007 and 2007 high). A measured objective from the pattern yields 125.72 and 128.12”;
- RSI indicator is estimating the uptrend to be continuing.
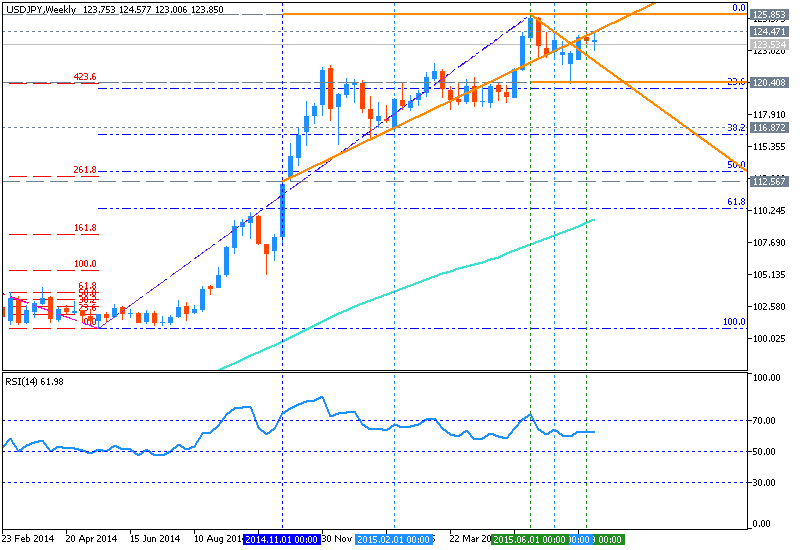
If the price will break 23.6% Fibo support level at 119.93 so we may see the secondary correction within the primary bullish.
If the price will break Fibo resistance level at 125.85 from below to above so the primary bullish market condition will be continuing.
If not so the price will be ranging between between the levels.
Trend: