Often we work on specific charts, currency pairs, limited to a few instruments. It's okay if it turns out consistently earn. But this trade does not give us information about what is happening in general in Forex, the behavior of other currencies in the charts. The output is a simple - to track the behavior of the currency in other pairs. But he does not give objective information. We can read that a particular currency is currently overbought or oversold. But how is this determined? Not Clear. This information is very important for the trader. If the currency is overbought, it is possible for it to open shorts on a few profitable pairs. And we can wait for a good profit. So I decided to write an overbought / oversold currency.
There is a good tool in many terminals of brokers - the dollar index, which can show it to USD. But it is inconvenient to use. The idea was the following - to make the oscillator of the national currency. That is, if he is in the overbought zone, so short, otherwise - Long.
On the basis of its oscillator Prise Reversal (free demo version) I wrote oscillators 7 national currencies: USD_PR, CAD_PR, JPY_PR, CHF_PR, EUR_PR, GBP_PR, AUD_PR. The essence of each of them is easy. It analyzes the behavior of a particular national currency on 6 major currency pairs (USDCAD, USDJPY, USDCHF, EURSD, GBPUSD, AUDUSD), and on the basis of this data forms on your own. Consider the following scenario:
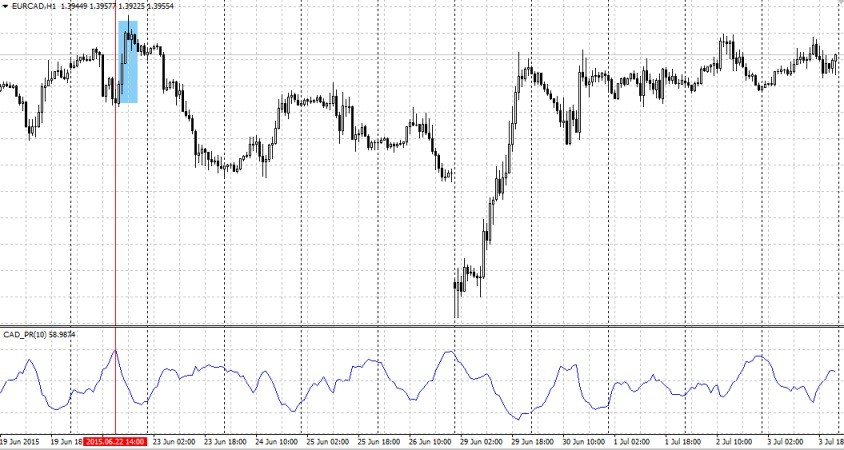
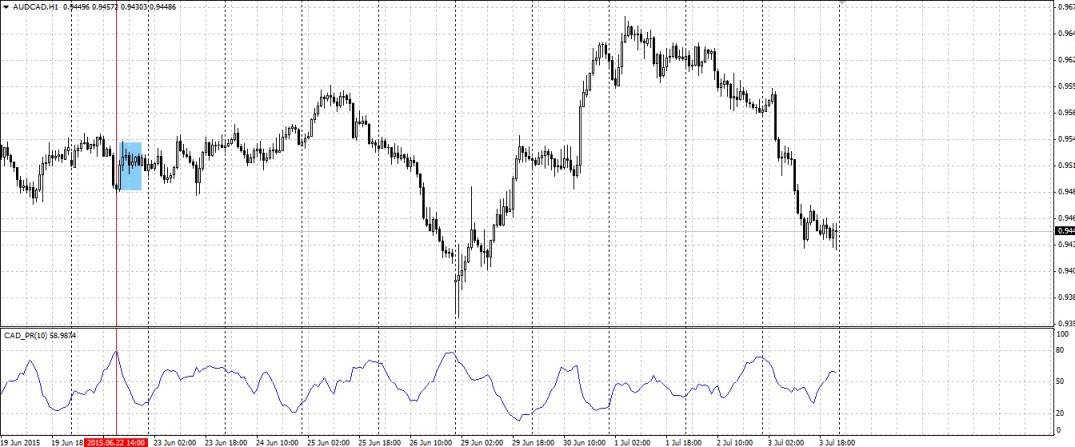
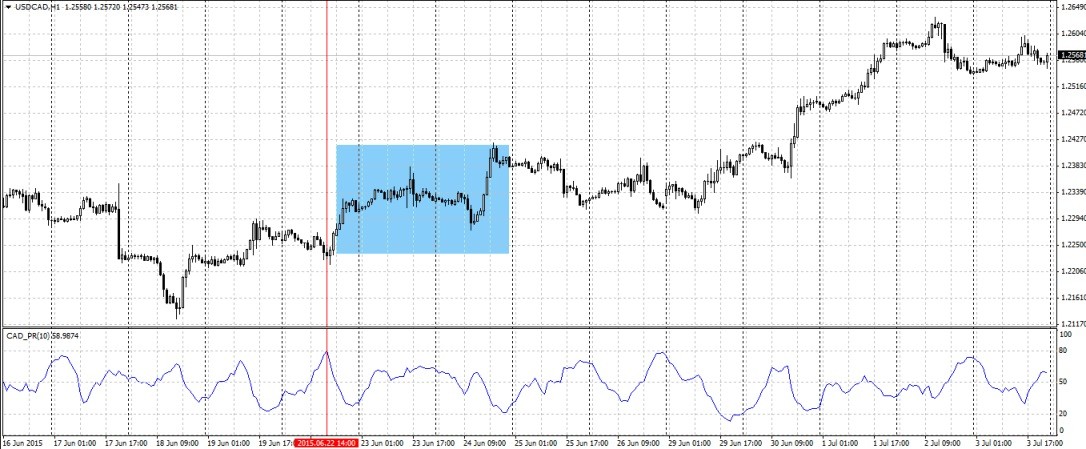
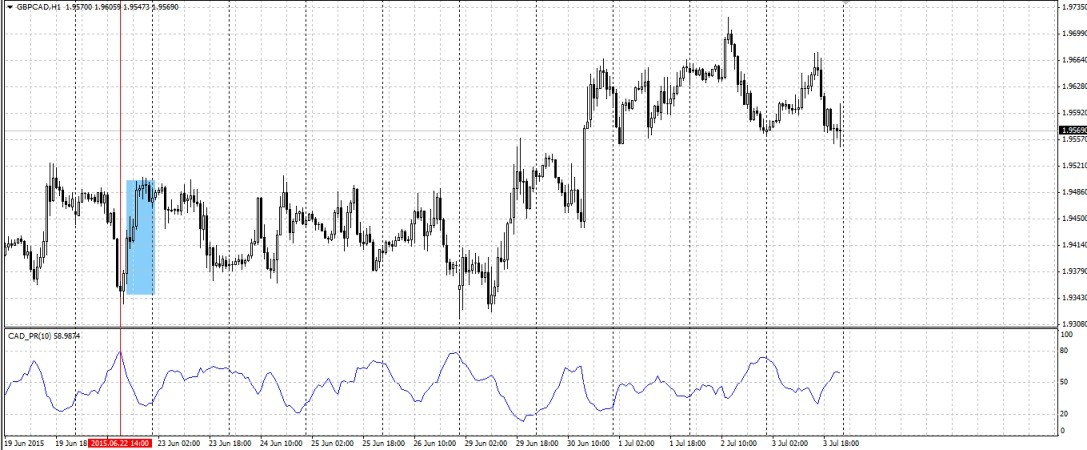
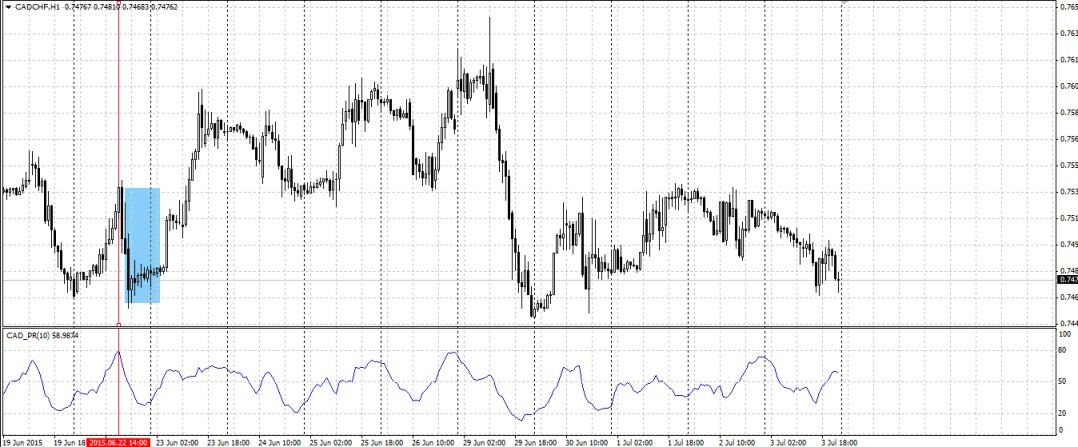
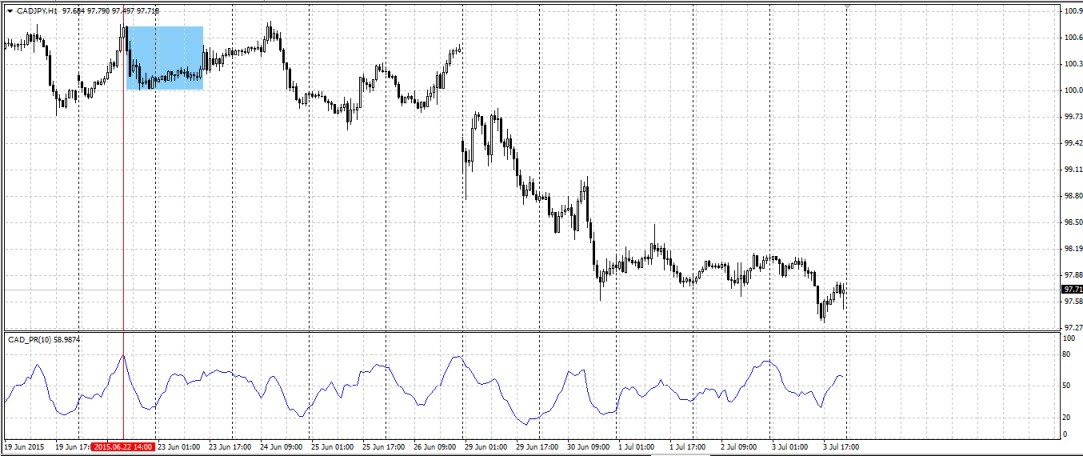
06.22.2015 at 14.00 CAD_PR indicator went up to the overbought zone (80), and hence can be a good point to sell the Canadian dollar. Indeed, as the chart shows, in fact, all six currency pairs can have good deal with a relatively good profit. But this is not always the case. We also have to consider the state of overbought / oversold the other national currency, for which plan to open. Ideally, the single currency was overbought, and the other, resold, but it happens very rarely. In this regard, we need to evaluate the potential of the movement of the second currency, as well as choose the correct entry point already on the schedule.
The pattern of these indicators is as follows:
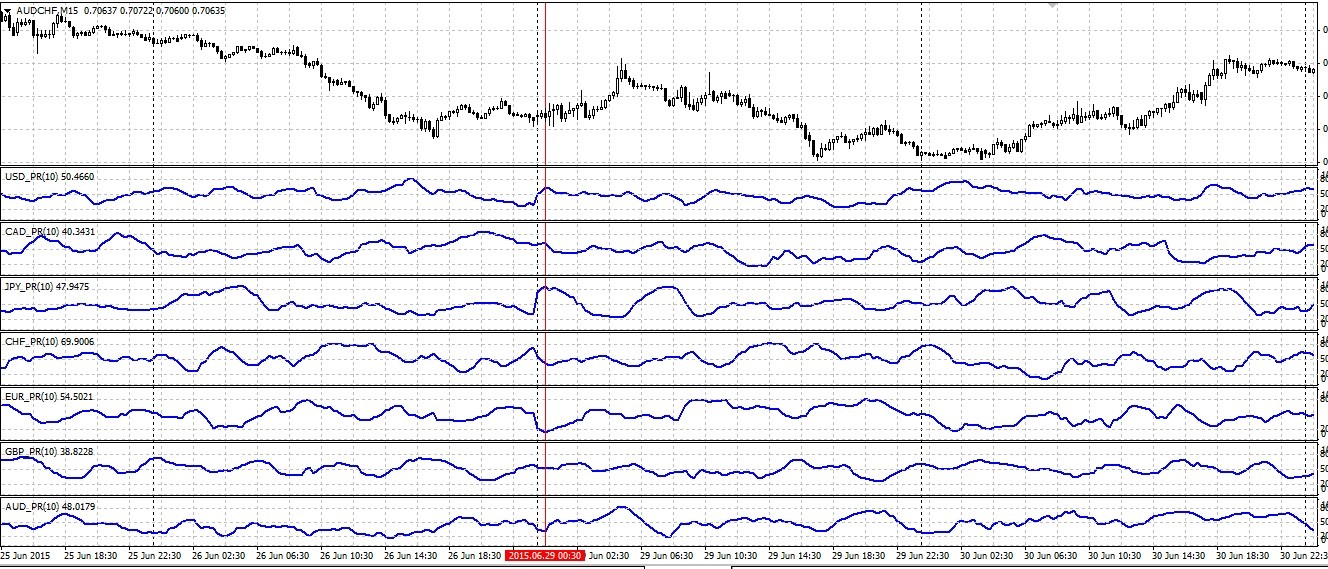
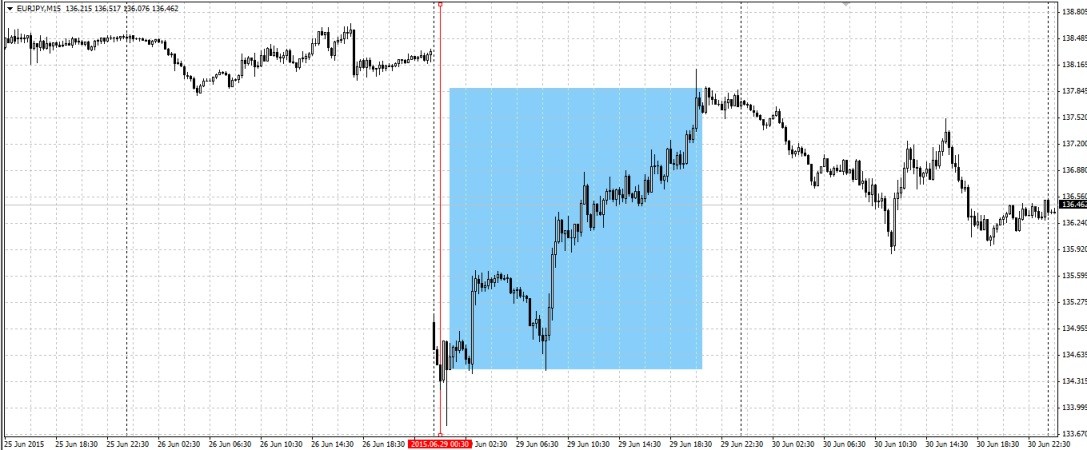
No matter what the chart we use, because it shows exactly the condition of those currencies, which are set indicators. We can only undergo substantial timeframe. And here, as in the picture there is a situation that 29.6.2015 at 00.30 Japanese yen was overbought and oversold euro, respectively, on a pair of EURJPY we can expect a good upward movement: