1
184
US DOLLAR TECHNICAL ANALYSIS - Prices continues to tread water after sliding to a three-week low last
week. A daily close below the 11834-9 area (May 20 close, 50% Fibonacci
retracement) exposes the 61.8% level at 11790.
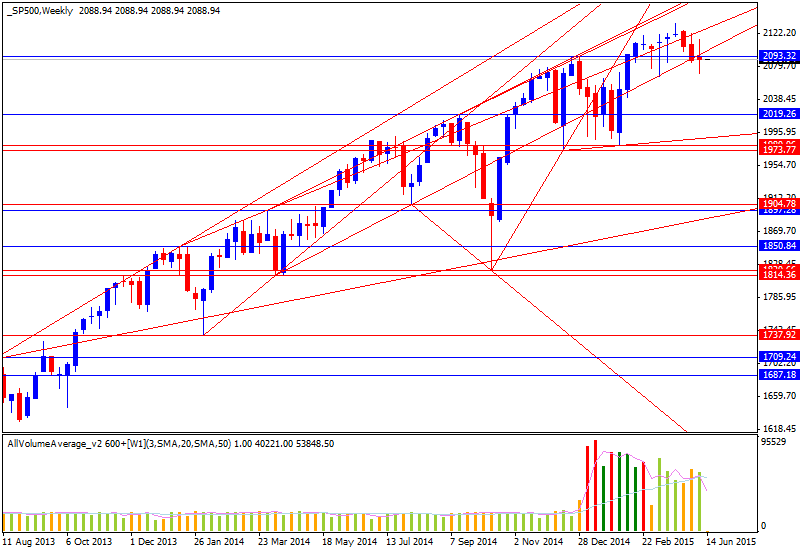
S&P 500 TECHNICAL ANALYSIS - Prices pulled back to test rising trend line support set from late-March lows once again, a barrier reinforced by the 61.8% Fibonacci retracement at 2077.20. A break below that targets the 76.4% level at 2063.00.
S&P 500 TECHNICAL ANALYSIS - Prices pulled back to test rising trend line support set from late-March lows once again, a barrier reinforced by the 61.8% Fibonacci retracement at 2077.20. A break below that targets the 76.4% level at 2063.00.
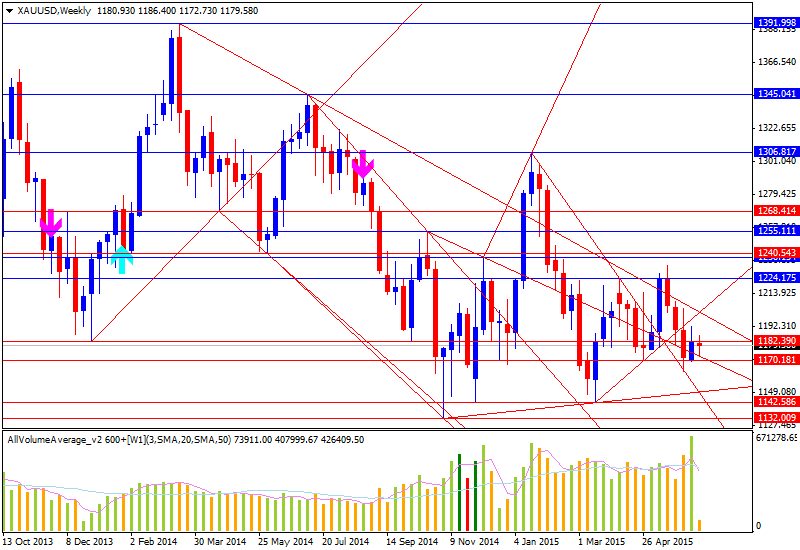
GOLD TECHNICAL ANALYSIS - Prices continue to tread water below the $1200/oz figure. A break below the 23.6% Fibonacci expansion at 1175.79 exposes the 38.2% level at 1165.62.
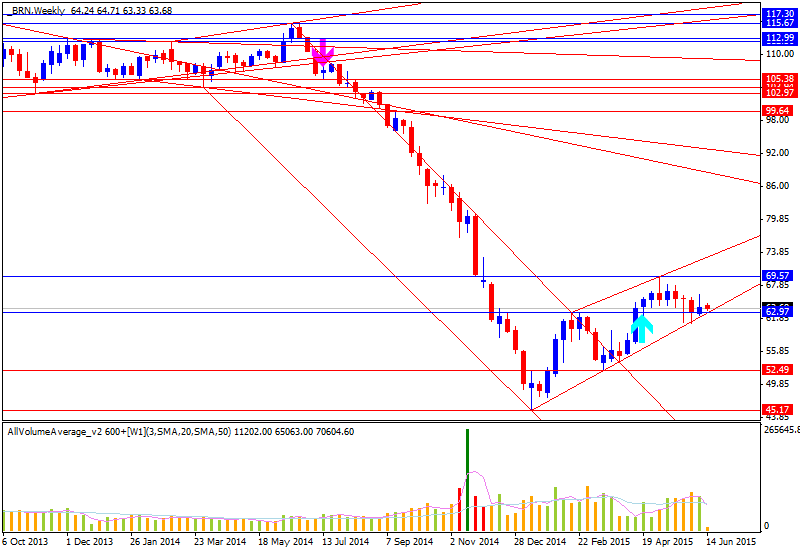
CRUDE OIL TECHNICAL ANALYSIS – Prices may be resuming the recovery launched from mid-January lows after completing a Flag continuation pattern. Near-term resistance is at 66.69, the 23.6% Fibonacci expansion, with a break above that exposing the 38.2% level at 70.25. Alternatively, a move below the 62.93-63.56 area (Flag top resistance-turned-support at, rising trend line) targets the 38.2% Fib retracement at 60.27.