Technical Analysis for US Dollar, S&P 500, Gold and Crude Oil - Prices Aim Higher After Clearing Chart Barriers

Prices turned lower as expected
after prices produced a bearish Evening Star candlestick pattern. A
daily close below the 11858-86 area (March 18 low, 23.6% Fibonacci
retracement) exposes the 38.2% level at 11679.

S&P 500 TECHNICAL ANALYSIS
Prices are consolidating after
moving lower as expected following the appearance of a bearish Evening
Star candlestick pattern. A daily close below the March 12low at 2040.10
exposes the 38.2% Fibonacci retracement at 2004.60. Alternatively, a
reversal above the 14.6% Fib expansion at 2084.00 targets the
2111.00-19.40 area (23.6% threshold, February 25 high).

GOLD TECHNICAL ANALYSIS
Prices look poised to continue higher
after clearing resistance at 1210.35, the 38.2% Fibonacci expansion.
From here, a daily close above the 50% level at 1231.28 exposes the
61.8% Fib at 1252.22. Alternatively, a reversal back below 1210.35
targets the March 31 low at 1178.38.

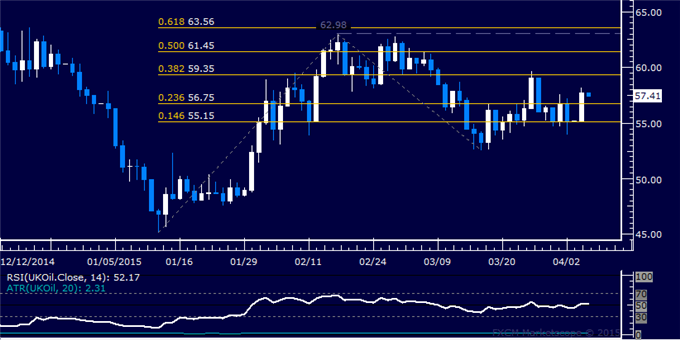
CRUDE OIL TECHNICAL ANALYSIS
Prices are aiming to test
resistance at 59.35, the 38.2% Fibonacci expansion, after pushing above
the 23.6% level at 56.75. A daily close above resistance exposes the 50%
Fib at 61.45. Alternatively, a reversal back below 56.75 targets the
14.6% expansion at 55.15.