Gold Price Forecast: Is Gold Moving Towards $817.50? The analysis by Rick Ackerman using Hidden Pivot methodology on gold’s monthly chart

The Hidden Pivot methodology shows the current 3 leg pattern (A-B, B-C, C-D) in play. The first leg started in September 2012 which marked point A, and reached point B in June 2013. The second leg, a bounce, was a very shortlived move from June 2013 (point B) till August 2013 (point C).
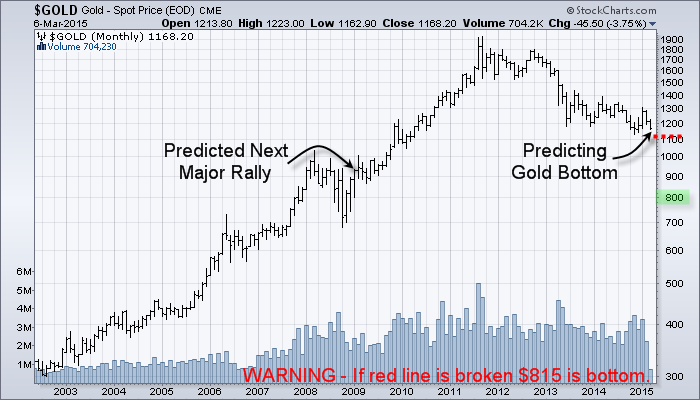
Since August 2013, gold is fulfilling a third and final leg of a Hidden Pivot pattern. That third leg points to a final target of 817.50 USD.
In this methodology, one of the key things is that the midpoint of the third leg (which is called “p”) is being confirmed by providing exact stopping power by means of a bounce PRECISELY at point “p”. That is the case for the current pattern, becasue gold has bounced several times at the 1151.60 price point on the monthly chart. So far, it confirms the validity of the pattern at play.
However, gold has not breached that price level “p” yet, providing a chance that it will never break below it. In case 1151.60 is not being breached on the monthly chart, it would decrease meaningfully the odds of achieving the final target of the pattern.
The key take-away for now is that traders and investors with a short
to mid-term investment horizon should carefully watch the 1151.60 USD
price level. It truly is a critical price level. In case gold would
stay above 1151.60 on a monthly basis, gold can be traded from the long side. However, if there would be a break below 1151.60 on the monthly chart, then the short trade is the right one until target D is reached.
Rick Ackerman details his view on gold’s big picture, based on his Hidden Pivot methodology, in this video: