The relative strength index or RSI is probably the most popular oscillator used by the FX trading community. It was developed by J. Welles Wilder Jr. to gage the strength or momentum of a currency pair. This indicator is calculated by comparing a currency pair’s current performance against its past performance, or its up days versus its down days. RSI is on a scale of 1-100, where any point above 70 is considered overbought, while any point below 30 is considered oversold. The standard time frame for this measure is 14 periods, although 9 and 25 periods are also commonly used. Generally, more periods tend to yield more accurate the data.

How Can RSI be Used for Trading?
RSI Can be Used to Identify Extreme Conditions or Reversals.
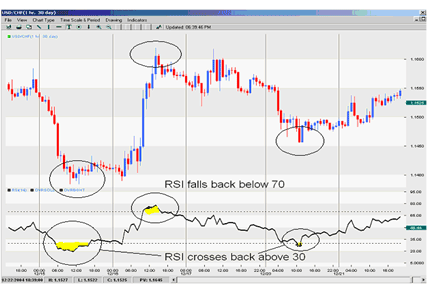
RSI above 70 is considered overbought and indicating a sell signal. RSI below 30 is considered oversold which would imply a buy signal. Some traders identify the long-term trend and then use extreme readings for entry points. If the long-term trend is bullish, then oversold readings could represent potential entry points.
RSI Can be Used to Indicate Divergence
Trade opportunities can also be generated by scanning for positive and negative divergences between the RSI and the underlying currency pair. For example, a falling currency pair where RSI rises from a low point of 15 back up to 50. With RSI, the underlying pair will often reverse its direction soon after such a divergence. Consistent with this example, divergences that occur after an overbought or oversold reading usually provide more reliable signals.


