Fan sayfamıza katılın
Öyleyse bir link gönderin -
başkalarının da faydalanmasını sağlayın
- Görüntülemeler:
- 5494
- Derecelendirme:
- Yayınlandı:
- 2018.03.01 11:38
-
 Ticaret fırsatlarını kaçırıyorsunuz:
- Ücretsiz ticaret uygulamaları
- İşlem kopyalama için 8.000'den fazla sinyal
- Finansal piyasaları keşfetmek için ekonomik haberler
Kayıt Giriş yapGizlilik ve Veri Koruma Politikasını ve MQL5.com Kullanım Şartlarını kabul edersiniz
Hesabınız yoksa, lütfen kaydolun
-
 Bu koda dayalı bir robota veya göstergeye mi ihtiyacınız var? Freelance üzerinden sipariş edin
Freelance'e git
Bu koda dayalı bir robota veya göstergeye mi ihtiyacınız var? Freelance üzerinden sipariş edin
Freelance'e git
The channel is based on the classic RSI and displays three zones, including the overbought zone, the oversold zone and the neutral zone, which is between the overbought and oversold zones. Suitable for higher timeframes starting with Daily.
The indicator has 9 input parameters:
- Channels period - period for calculating the channels;
- Period of smoothing - smoothing period;
- Overbought level - RSI overbought level;
- Upper level of neutral zone - the upper level of the neutral zone (equal to the lower level of the overbought zone);
- Lower level of neutral zone - the lower level of the neutral zone (equal to the upper level of the oversold zone);
- Oversold level - RSI oversold level;
- Applied price - RSI calculation price;
- Color of overbought zone - the color of the overbought zone cloud;
- Color of oversold zone - the color of the oversold zone cloud.
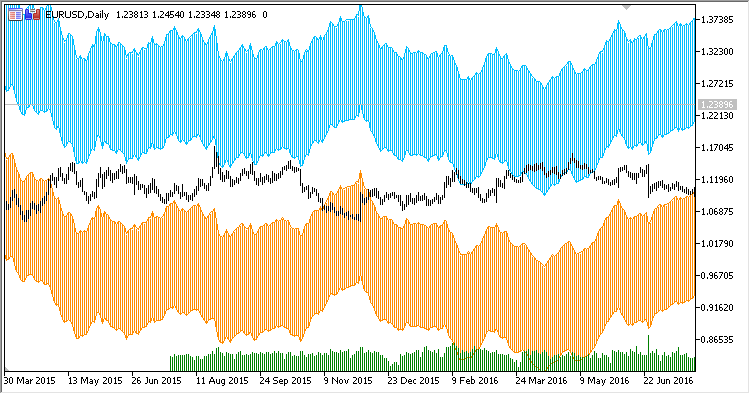
Fig.1 WRPC on the daily chart

Fig.2 WRPC on the weekly chart

Fig.3 WRPC on the monthly chart
MetaQuotes Ltd tarafından Rusçadan çevrilmiştir.
Orijinal kod: https://www.mql5.com/ru/code/19883
 AMACD
AMACD
Classic MACD based on Adaptive Moving Average.
Asymmetric Trend Pressure
The Asymmetric Trend Pressure indicator shows the trend direction and strength line. It can additionally show the bullish and bearish components of the trend.
Polynomial Regression
A polynomial regression channel.
Difference
The Difference indicator shows the difference between the current prices and prices as of N periods ago.