Participe de nossa página de fãs
Coloque um link para ele, e permita que outras pessoas também o avaliem
Avalie seu funcionamento no terminal MetaTrader 5
- Visualizações:
- 82750
- Avaliação:
- Publicado:
- 2009.04.17 09:17
- Atualizado:
- 2014.04.21 14:53
-
 Você está perdendo oportunidades de negociação:
- Aplicativos de negociação gratuitos
- 8 000+ sinais para cópia
- Notícias econômicas para análise dos mercados financeiros
Registro LoginVocê concorda com a política do site e com os termos de uso
Se você não tem uma conta, por favor registre-se -
 Precisa de um robô ou indicador baseado nesse código? Solicite-o no Freelance
Ir para Freelance
Precisa de um robô ou indicador baseado nesse código? Solicite-o no Freelance
Ir para Freelance
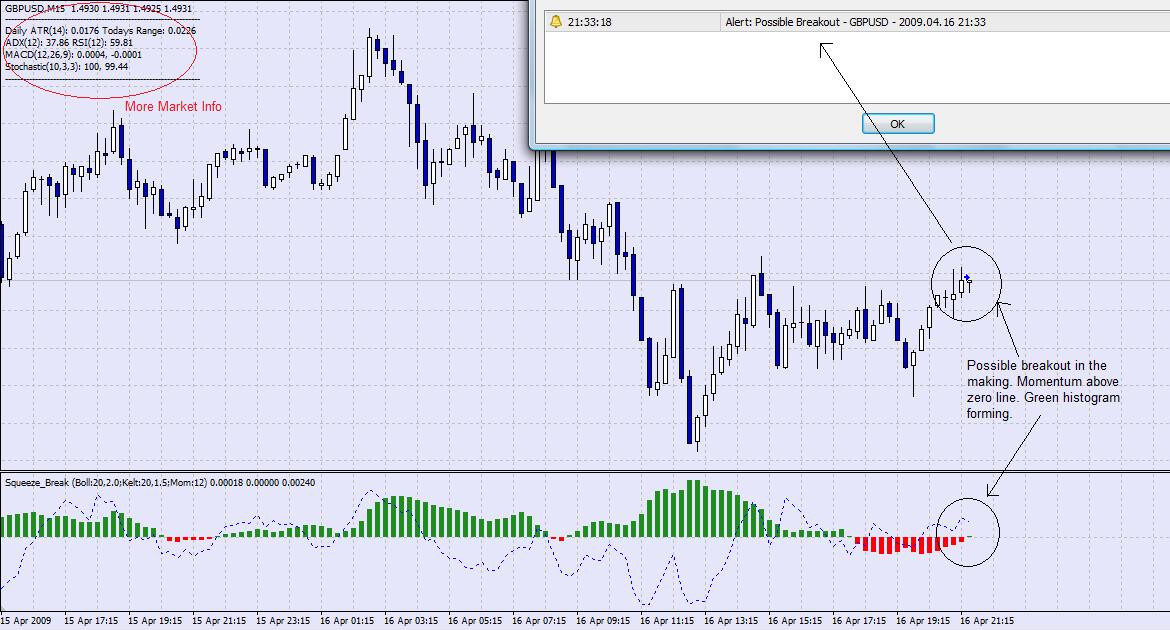
This indicator is based on a strategy mentioned in John Carter's book, Mastering the Trade. The basic idea
behind the strategy is that markets tend to move from periods of low volatility to high volatility and
visa versa. The strategy aims to capture moves from low to high volatility.
For gauging this he uses two
common indicators - Bollinger Bands and Keltner Channels (ok, not so common!). He also uses the Momentum
indicator to provide a trade bias as some as the Bollinger Bands come back outside the Keltner Channels.
The Squeeze_Break indicator combines this into a signal indicator and has the following components:
- A positive green histogram means that the Bollinger Bands are outside the Keltner Channels
and the market is lightly to be trending or volatile.The stronger the histogram the stronger
the directional price move.
- A negative red histogram means that the Bollinger Bands are inside the Keltner Channels
and the market is lightly to be consolidating. The stronger the red histogram the tighter
price action is becoming.
- Incorporated into the indicator is a Momentum indicator. According to the strategy J. Carter
goes long when the Bollinger Bands break outside the Keltner Bands and the Momentum indicator
is above the zero line. He goes short when the Momentum indicator is below the zero line.
- I've also added other indicator info in the top left hand corner to give a broader idea
of current market conditions.
- The indicator provides audio alerts when a potential breakout is occurring. This indicator tends to be better with the larger timeframes. Personally I don't trade purely on
an alert signal alone. It's just a handy tool for warning me of changes in price action and potential breakouts.

 ytg_ObjectsDeleteAll
Scripts deletes all objects from the diagram.
 Stochasic Chaikin's Volatility
This is stochasticzation of Chaikin's Volatility