#define GRAPH_WIDTH 750
#define GRAPH_HEIGHT 350
#include <Graphics\Graphic.mqh>
CGraphic ExtGraph;
//+------------------------------------------------------------------+
//| Script program start function |
//+------------------------------------------------------------------+
void OnStart()
{
vector delta=vector::Full(10,10);
delta[0]=0;
//--- 델타 단계를 사용하여 0에서 2pi까지 101개의 값을 얻습니다.
vector X=delta.CumSum();
//--- X 벡터의 각 값에 대한 아크 탄젠트 값을 계산합니다.
vector Y=delta.CumSum();
Print("vector delta = \n",delta);
Print("vector X = \n",X);
Print("vector Y = \n",Y);
//--- 계산된 값을 벡터에서 배열로 전송합니다.
double x_array[];;
double y_array[];;
X.Swap(x_array);
Y.Swap(y_array);
double array[10];
for(int i=0; i<10; i++)
{
array[i]=MathArctan2(y_array[i],x_array[i]);
}
//--- 계산된 벡터 값의 그래프를 그립니다.
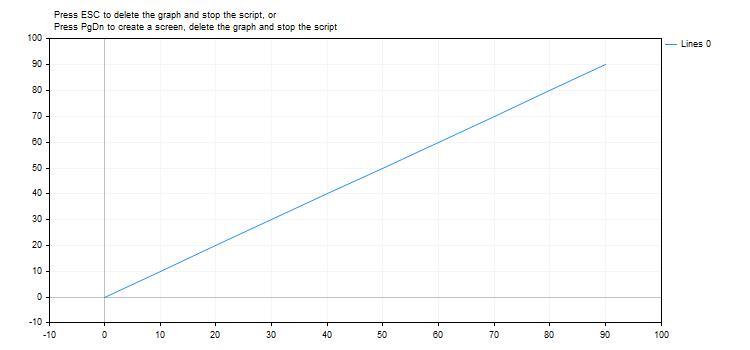
CurvePlot(x_array,y_array,clrDodgerBlue);
//--- Escape 또는 PgDn 키를 눌러 그래프를 삭제하고(스크린샷 하기) 종료할 때까지 기다립니다.
while(!IsStopped())
{
if(StopKeyPressed())
break;
Sleep(16);
}
//--- 모두 삭제
ExtGraph.Destroy();
}
//+------------------------------------------------------------------+
//| ESC를 누르면 'true'를 반환합니다 |
//| PgDn을 누르면 그래프 스크린샷을 찍고 'true'를 반환합니다 |
//| 그렇지 않으면 'false'를 반환 합니다 |
//+------------------------------------------------------------------+
bool StopKeyPressed()
{
//--- ESC를 누르면 'true'를 반환합니다.
if(TerminalInfoInteger(TERMINAL_KEYSTATE_ESCAPE)!=0)
return(true);
//--- PgDn을 누르고 그래프 스크린샷이 성공적으로 촬영되면 'true'를 반환합니다
if(TerminalInfoInteger(TERMINAL_KEYSTATE_PAGEDOWN)!=0 && MakeAndSaveScreenshot(MQLInfoString(MQL_PROGRAM_NAME)+"_Screenshot"))
return(true);
//--- 'false'를 반환합니다
return(false);
}
//+------------------------------------------------------------------+
//| 그래프 객체를 만들고 곡선 그리기 |
//+------------------------------------------------------------------+
void CurvePlot(double &x_array[], double &y_array[], const color colour)
{
ExtGraph.Create(ChartID(), "Graphic", 0, 0, 0, GRAPH_WIDTH, GRAPH_HEIGHT);
ExtGraph.CurveAdd(x_array, y_array, ColorToARGB(colour), CURVE_LINES);
ExtGraph.IndentUp(30);
ExtGraph.CurvePlotAll();
stringtext1="그래프를 삭제하고 스크립트를 중지하려면 ESC를 누르십시오. 또는";
stringtext2=" 화면을 만들고 그래프를 삭제하고 스크립트를 중지하려면 PgDn을 누르세요";
ExtGraph.TextAdd(54, 9, text1, ColorToARGB(clrBlack));
ExtGraph.TextAdd(54,21, text2, ColorToARGB(clrBlack));
ExtGraph.Update();
}
//+------------------------------------------------------------------+
//| 스크린샷을 찍어 이미지를 파일로 저장 |
//+------------------------------------------------------------------+
bool MakeAndSaveScreenshot(const string file_name)
{
string file_names[];
ResetLastError();
int selected=FileSelectDialog("Save Picture", NULL, "All files (*.*)|*.*", FSD_WRITE_FILE, file_names, file_name+".png");
if(selected<1)
{
if(selected<0)
PrintFormat("%s: FileSelectDialog() function returned error %d", __FUNCTION__, GetLastError());
return false;
}
bool res=false;
if(ChartSetInteger(0,CHART_SHOW,false))
res=ChartScreenShot(0, file_names[0], GRAPH_WIDTH, GRAPH_HEIGHT);
ChartSetInteger(0,CHART_SHOW,true);
return(res);
}
|