
インジケーターの外部パラメーターのグラフィックコントロール
はじめに
インジケーターの外部パラメーターをどのくらいの頻度で設定、変更する必要があるのでしょうか?便利にアイコンやオブジェクトを必要なポジションにマウスを用いて、ドラッグできるようにするため、それらをチャートに動かし、インジケーターのセットアップ手続きを単純化することを考えたことがあるはずです。MQL4言語は、スクリーン上でインジケーターの設定の表示を可能にします。
パラメーターの視覚的コントロール
まず、インジケーターにどのようなパラメーターがあり、それらのうちのどれを変更するかを理解する必要があります。このために、そのインジケーター属性を開き、作業中に変更される必要のあるパラメーター名を書き出してください。
例として、標準ターミナルデリバリにふくまれているZigZagを用います。その属性の変数名を選択します。
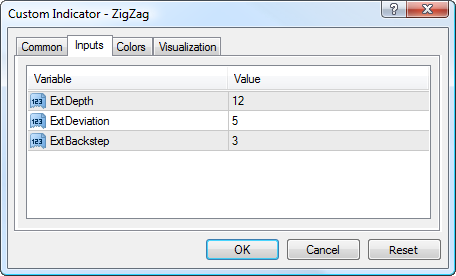
インジケーターパラメーター
ExtDepth=12
ExtDeviation=5
ExtBackstep=3
インジケータパラメーター値を変更するために使用される配列と変数を作成します。
インジケーター名は、管理するインジケーターのパラメーターにしたがって設定されます。
// Initial indicator values
int               ExtDepth=12;
int               ExtDeviation=5;
int               ExtBackstep=3;
//---- indicator buffers
double            ZigzagBuffer[];
double            HighMapBuffer[];
double            LowMapBuffer[];
// Array of indicator parameter variables
string            ArrExt[3,3]    ={"12","21","34", "5","8","21", "3","13","34"};
// Arrays of indices
string            Array_Index[]={"Dep -> ","Dev -> ","Back ->"};
int               Coordinats_IndexUp[]={65,160,260};
int               Coordinats_Index[]  ={35,130,230};
int               Coordinats_IndexDn[]={5, 100,200};
// Color for parameter blocks and indices
color             Color_[]={Blue,Green,Red};
この段階ではまだわかりやすいと思います。
"Dep -> ","Dev -> ","Back ->"
は、それぞれExtDepth、ExtDeviation、ExtBackstepです。こちらはどのようにチャートに表示されるかを示しています。
その各パラメーターのために3つの変数値を使用します。
string            ArrExtDepth[]    ={"12","15","20"};
string            ArrExtDeviation[]={"5",  "8","21"};
string            ArrExtBackstep[] ={"3", "13","34"};
利便性のために3次元配列にて保持されます:
string ArrExt[3,3] ={"12","21","34", "5","8","21", "3","13","34"};
3、5、12は、標準ZigZagインジケーターのパラメーターに標準で設定されている標準値です。
その他の値は、例としてこちらに提示されています。インジケータのコントロールのためにパラメーター変数として使用されます。
たくさんの描画があることを考慮して、オブジェクトを作成し、個別ブロックに移動させるための関数を配置します:
void Obj_CreateMove_Text (int CreateMove, string Name, int Type, string Number,  color text_color,
                          int DistX, int DistY)
   {
      if (CreateMove==0)
      ObjectCreate(Name,Type,0,0,0);
      ObjectSetText(Name,Number,10,"Arial",text_color);
      ObjectSet(Name,101,3);
      ObjectSet(Name, 102, DistX);
      ObjectSet(Name, 103, DistY);
   }
コードを魂魄とに保ち、操作の容易性を保証するためにグラフィカルオブジェクトの座標はすべて配列に保持されます。これは、すでに上記で示されています(記事の最初をご覧ください)
それでは、チャートウィンドウにすべてのオブジェクトを描画しましょう。
チャートの右側は、あまり情報を読み込まず、その変数がウィンドウの右側に垂直に並べられるようにしています。それぞれのパラメータは、一致するパラメーターの色と同じようになるインデックスを持ちます。
したがって、3つのパラメーターインデックスと3つの変数値をそれぞれのパラメーターに対して作成する必要があります。
インジケーターパラメーターのためにオブジェクトを作成し、これらのパラメーターに変数値を表示し、それぞれのパラメータブロックの横に一致するインデックスを作成してください。
// Create objects
   for( ii=0;ii<3;ii++)
      for( i=0;i<3;i++)
      Obj_CreateMove_Text (0, Array_Index[ii]+i, 23, (ArrExt[ii,i]), Color_[ii], 5, Coordinats_IndexDn[ii]+30*i);
      for( i=0;i<3;i++)
      Obj_CreateMove_Text (0, "Index"+Array_Index[i], 23, (Array_Index[i]),   Color_[i], 25, Coordinats_Index[i]);

図1
あとは、関連するインデックスが移動された際にユーザーのアクションをハンドリングするためのブロックを作成するのみです。
チャート上にオブジェクトのアンカーポイントがあり、それにしたがって一つ一つインデックスパラメーターを読み込み、プログラムロジックを決定します。
// Read index coordinates from the chart
      for( i=0;i<3;i++)
           {
            Coordinats[i]=ObjectGet("Index"+Array_Index[i],OBJPROP_YDISTANCE);
               if (Coordinats[i]==0)//If outside of the chart, set again
                  Obj_CreateMove_Text (1, "Index"+Array_Index[i], 23, Array_Index[i], Color_[i], 25, Coordinats_IndexDn[i]);
           }
取得された値が保存されたので、チャートのポジションを分析し、やる必要のあることを済ませます。その分析に関して、実際のインデックスのポジションを使用し、参照点として使用されるパラメーターの値に関連する3つそれぞれのインデックス値を取得します。もしそのインデックスがそのグループにて最高の値よりも上に動いた場合、その最高値を超えたと判断されます。もしそのインデックスが最低のパラメーター値よりも下に動けば、同様に最低のパラメーター値まで低下したと考えられます。もしそのインデックスがそのパラメーターの最高・最低値の間にあれば、中間の値を取得します。比較のため、垂直スケール、つまり、
OBJPROP_YDISTANCEパラメーターを使用します。ObjectGet()// Analyze positions of indices for( i=0;i<3;i++) { if (Coordinats[i]>Coordinats_IndexUp[i]) {Move[i] = Coordinats_IndexUp[i]; index[i]=2;}// Index has been moved up if (Coordinats[i]>Coordinats_IndexDn[i] && Coordinats[i]<Coordinats_IndexUp[i]) {Move[i] = Coordinats_Index[i]; index[i]=1;}// Index is in the middle if (Coordinats[i]<Coordinats_IndexDn[i]) {Move[i] = Coordinats_IndexDn[i]; index[i]=0;}// Index has been moved down if (Move[i]!=0)
そして、移動したオブジェクト一列に整列させます。
ZigZag描画のために新しいパラメーター値を保存します。
グラフィカルコントロールを用いいて設定された値に基づいてインジケーターを描画してください。
// Move and align the objects depending on their positions
            Obj_CreateMove_Text (1, "Index"+Array_Index[i], 23, Array_Index[i], Color_[i], 25, Move[i]);
// Save ZigZag parameter values
            switch (i)
               {
                case 0:  ExtDepth =     StrToInteger(ArrExt[0,index[i]]);  break;
                case 1:  ExtDeviation = StrToInteger(ArrExt[1,index[i]]);  break;
                case 2:  ExtBackstep =  StrToInteger(ArrExt[2,index[i]]);  break;
               }/**/
          }
 // Pass parameter values to the custom indicator and plot ZigZag based on the obtained values
     for(i=300;i>0;i--)
            {
               ZigzagBuffer[i]=iCustom(NULL,0,"ZigZag",ExtDepth,ExtDeviation,ExtBackstep,0,i);
               HighMapBuffer[i]=iCustom(NULL,0,"ZigZag",ExtDepth,ExtDeviation,ExtBackstep,1,i);
               LowMapBuffer[i]=iCustom(NULL,0,"ZigZag",ExtDepth,ExtDeviation,ExtBackstep,2,i);
            }
作動させるためグラフィカルオブジェクトをどれかダブルクリックしてください。作動されれば、そのオブジェクトはマウスを用いてコントロールできます。これは、パラメーター値を変更するたびに実行されます。

図2
図3
図4
そのコードの最終的なバージョンは以下の通りです。
//+------------------------------------------------------------------+
//|                                         management_indicator.mq4 |
//|                                  Copyright © 2009, WWW.FIBOOK.RU |
//|                                             http://www.fibook.ru |
//+------------------------------------------------------------------+
#property copyright "Copyright © 2009, WWW.FIBOOK.RU"
#property link      "http://www.fibook.ru"

#property indicator_chart_window
#property indicator_buffers 1
#property indicator_color1 Red
// Initial indicator values
int               ExtDepth=12;
int               ExtDeviation=5;
int               ExtBackstep=3;
//---- indicator buffers
double            ZigzagBuffer[];
double            HighMapBuffer[];
double            LowMapBuffer[];
// Array of indicator parameter variables
string            ArrExt[3,3]    ={"12","21","34", "5","8","21", "3","13","34"};
// Arrays of indices
string            Array_Index[]={"Dep -> ","Dev -> ","Back ->"};
int               Coordinats_IndexUp[]={65,160,260};
int               Coordinats_Index[]  ={35,130,230};
int               Coordinats_IndexDn[]={5, 100,200};
// Color for parameter blocks and indices
color             Color_[]={Blue,Green,Red};
// Variables for calculations
int               i,ii;
int               index[3];
//+------------------------------------------------------------------+
//| Custom indicator initialization function                         |
//+------------------------------------------------------------------+
int init()
  {
//---- indicators
   IndicatorBuffers(3);
//---- drawing settings
   SetIndexStyle(0,DRAW_SECTION);
//---- indicator buffers mapping
   SetIndexBuffer(0,ZigzagBuffer);
   SetIndexBuffer(1,HighMapBuffer);
   SetIndexBuffer(2,LowMapBuffer);
   SetIndexEmptyValue(0,0.0);
//----
   return(0);
  }
//+------------------------------------------------------------------+
//| Custom indicator deinitialization function                       |
//+------------------------------------------------------------------+
int deinit()
  {
//----

//----
   return(0);
  }
//+------------------------------------------------------------------+
//| Custom indicator iteration function                              |
//+------------------------------------------------------------------+
int start()
  {
int  Coordinats[3];
int  Move[3];
// Check if index objects are on the chart
   if (ObjectGet("IndexDep -> ",OBJPROP_YDISTANCE)<1||
       ObjectGet("IndexDev -> ",OBJPROP_YDISTANCE)<1||
       ObjectGet("IndexBack ->",OBJPROP_YDISTANCE)<1)
// If they are not on the chart, create them
               {
      for( ii=0;ii<3;ii++)
       for( i=0;i<3;i++)
        Obj_CreateMove_Text (0, Array_Index[ii]+i, 23, ArrExt[ii,i], Color_[ii], 5, Coordinats_IndexDn[ii]+30*i);
       for( i=0;i<3;i++)
        Obj_CreateMove_Text (0, "Index"+Array_Index[i], 23, Array_Index[i], Color_[i], 25, Coordinats_IndexDn[i]);
               }
// Read index coordinates from the chart
      for( i=0;i<3;i++)
           {
            Coordinats[i]=ObjectGet("Index"+Array_Index[i],OBJPROP_YDISTANCE);
               if (Coordinats[i]==0)//If outside of the chart, set again
                  Obj_CreateMove_Text (1, "Index"+Array_Index[i], 23, Array_Index[i], Color_[i], 25, Coordinats_IndexDn[i]);
           }
// Analyze positions of indices
      for( i=0;i<3;i++)
         {
            if (Coordinats[i]>Coordinats_IndexUp[i])
                  {Move[i] = Coordinats_IndexUp[i]; index[i]=2;}//Index has been moved up
            if (Coordinats[i]>Coordinats_IndexDn[i]  &&
                Coordinats[i]<Coordinats_IndexUp[i])
                  {Move[i] = Coordinats_Index[i];   index[i]=1;}// Index is in the middle
            if (Coordinats[i]<Coordinats_IndexDn[i])
                  {Move[i] = Coordinats_IndexDn[i]; index[i]=0;}// Index has been moved down
            if (Move[i]!=0)
// Move and align the objects depending on their positions
            Obj_CreateMove_Text (1, "Index"+Array_Index[i], 23, Array_Index[i], Color_[i], 25, Move[i]);
// Save ZigZag parameter values
            switch (i)
               {
                case 0:  ExtDepth =     StrToInteger(ArrExt[0,index[i]]);  break;
                case 1:  ExtDeviation = StrToInteger(ArrExt[1,index[i]]);  break;
                case 2:  ExtBackstep =  StrToInteger(ArrExt[2,index[i]]);  break;
               }/**/
          }
 // Pass parameter values to the custom indicator and plot ZigZag based on the obtained values
     for(i=300;i>0;i--)
            {
               ZigzagBuffer[i]=iCustom(NULL,0,"ZigZag",ExtDepth,ExtDeviation,ExtBackstep,0,i);
               HighMapBuffer[i]=iCustom(NULL,0,"ZigZag",ExtDepth,ExtDeviation,ExtBackstep,1,i);
               LowMapBuffer[i]=iCustom(NULL,0,"ZigZag",ExtDepth,ExtDeviation,ExtBackstep,2,i);
            }
Comment ("ExtDepth =",ExtDepth,", ExtDeviation =",ExtDeviation,", ExtBackstep =",ExtBackstep);
//----
   return(0);
  }
// Function for creating and moving graphical objects
void Obj_CreateMove_Text (int CreateMove, string Name, int Type, string Number,  color text_color, int DistX, int DistY)
   {
      if (CreateMove==0)
      ObjectCreate(Name,Type,0,0,0);
      ObjectSetText(Name,Number,10,"Arial",text_color);
      ObjectSet(Name,101,3);
      ObjectSet(Name, 102, DistX);
      ObjectSet(Name, 103, DistY);
   }


//+------------------------------------------------------------------+
まとめ
上記で紹介されているアプローチは、設定される必要のあるパラメーターを表示することで外部からインジケーターを管理することができるよう実装されています。
MetaQuotes Ltdによってロシア語から翻訳されました。
元の記事: https://www.mql5.com/ru/articles/1370

 Accumulation/Distributionへのインサイトと、そのゴール地点
 一般的トレーディングシステムを基にしたExpert Advisors と売買ロボット最適化の錬金術(パート3)
 トレーダーキット:Drag Trader Library
- 無料取引アプリ
- 8千を超えるシグナルをコピー
- 金融ニュースで金融マーケットを探索