Pon "Me gusta" y sigue las noticias
Deje un enlace a él, ¡qué los demás también lo valoren!
Evalúe su trabajo en el terminal MetaTrader 5
- Visualizaciones:
- 15639
- Ranking:
- Publicado:
- Actualizado:
-
 Está perdiendo oportunidades comerciales:
- Aplicaciones de trading gratuitas
- 8 000+ señales para copiar
- Noticias económicas para analizar los mercados financieros
Registro EntradaUsted acepta la política del sitio web y las condiciones de uso
Si no tiene cuenta de usuario, regístrese -
 ¿Necesita un robot o indicador basado en este código? Solicítelo en la bolsa freelance
Pasar a la bolsa
¿Necesita un robot o indicador basado en este código? Solicítelo en la bolsa freelance
Pasar a la bolsa
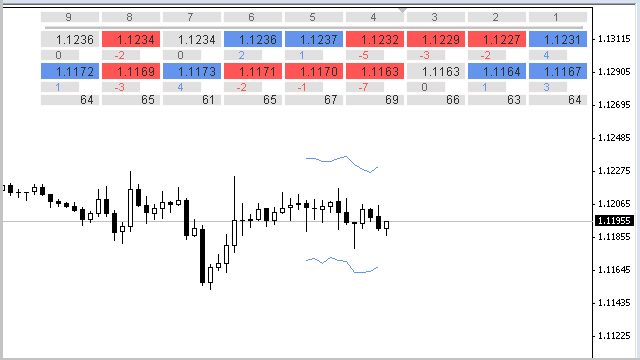
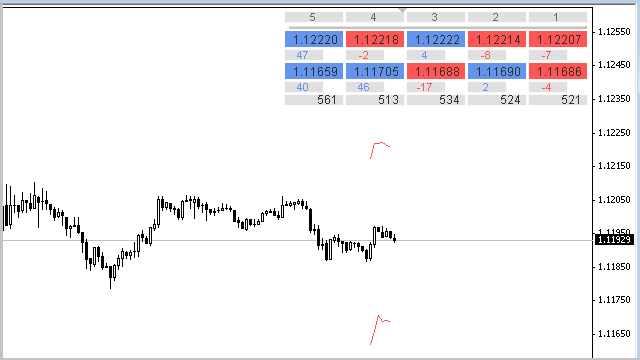
By default, this indicator displays nine values of two different Moving Averages (МА) for the current timeframe, a difference between previous sequential МА values and a difference between MAs in points. You can set the data display with positive or negative offsets and/or rounded to required decimal digits. Displaying the values for zero (current) bar is not supported.
It can be used to simply display the Open and/or High, and/or Low, and/or Close marks of the bars and the deltas between them (including, for example, the ones for the display of the candlestick/bar sizes from High to Low).
There is the same indicator in the Code Base for the MetaTrader 5.
For the values of МА marks (or bars) and deltas between the subsequent adjacent values, the colors in the indicator table change automatically. Different colors apply for the value changes to greater, lesser and/or equal. The change of color of the delta values between the two moving averages (bars or offsets) themselves is not provided. The calculation and modification of values take place when a new bar/bars arrive, when the indicator parameters change, when there is a change in the timeframe or in the symbol of the chart the indicator is attached to.
If nine values in each table row by X axis is too much or too low, then to change the number of cells and thus the amount of calculated and displayed data, you need to change 9 to positive number >= 2 in this line of code:
#define ARRAY_SIZE_X 9
Additional information:
- The indicator table has a "secret": if it is temporarily not required on the chart, it can be hidden by clicking the horizontal bar under the table heading.
Note: The table heading shows the bar numbers, for which the indicator displays the MA values. In the indicator parameters, you can change the starting bar number to any positive non-zero value.
The reason for not including the zero bar is that it didn't require to display constantly changing data for the current (zero) bar. However, if you require to display data (results) changing with every tick for a currently forming bar, you need to implement a slightly different code structure.
The code attached here consumes computing resources sparingly, also at the cost of multiple condition checks and limitations specified in the code, and does not calculate and recalculate the values of the MA and deltas on every tick.
In fact, the limitation for current (zero) bars applies only to values in the table. So you can, if required, add lines to the code, for example, to implement notifications (alerts etc.) triggering when the current price breaks through certain values from the table, previously set as separate global variables. You can also trigger the notifications when certain "new" values from the table are less than/greater than or equal to certain "old" values. Also, you can replace the existing MA or bar mark calculations with some other required calculations.
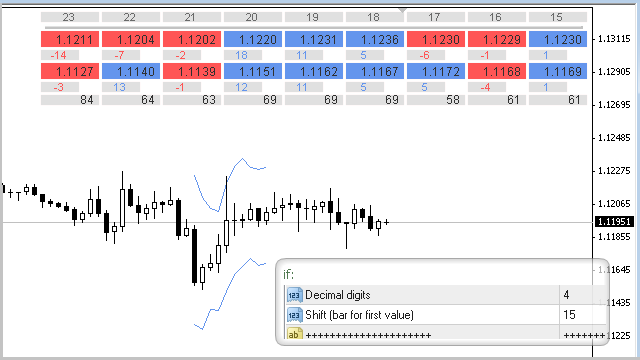
- You can view the parameters of each Moving Average (set in the input parameters or remaining by default) at any time by hovering the cursor over the table cells.
Note: Tooltips with parameter values will display only if the "Show object descriptions" option is turned on in the chart properties.
- Instead of МА values, you can set the display of data with required positive or negative offsets in points from each Moving Average or bar marks.
Note: To make the indicator display Open and/or High and/or Low and/or Close of adjacent bars and differences between them instead of MA calculations, you need to set the following MA values in the input parameters:With this set of parameters, the indicator will calculate values directly by bar marks, without calling the iMA function.
- Period Moving Averages... = 1;
- MA method...= MODE_SMA;
- Apply to... = PRICE_OPEN or PRICE_HIGH, or PRICE_LOW, or PRICE_CLOSE.
- If you need to round the МА values to a certain decimal digit, set the required value (number of decimal digits) for Decimal digits input parameter.
- You can also turn off the display of indicator lines in the input parameters.
Note: Line colors depend on the direction of the first calculated bar values, which is set in the line: "Shift (bar for first value):". The indicator lines are plotted 1 bar longer deep into the chart than the number of МА values in the table (this allows to see which mark the last bar in the table is compared with).
- In the input parameters, apart from the MA settings, you can also change the table offset by X and Y axis, table cells size, font size, colors, and bring the table to front (by default, the table is rendered in the background, to avoid obscuring the bars).
Version 1.81 of 05.08.2015:
Adjustments to the code, which did not increase or reduce the capabilities of the indicator. Conducted to increase the similarity to the code of the same indicator for MetaTrader 5 (also to increase the code correctness and thriftiness of its operation).
Version 1.86 of 25.09.2015:
- The limitation of the maximum value of the Moving Averages period is increased in the code from 500 to 3000 bars. As this limitation is set by user, you can change this value to another positive integer, if necessary. It is set in the body of the function:
bool CheckInput(int period,string text)
- Conducted small cosmetic and safety-optimization edits in the code.
Traducción del ruso realizada por MetaQuotes Ltd
Artículo original: https://www.mql5.com/ru/code/13266
 Grid
Grid
Arrangement of the pending orders at equal intervals (steps).
 Tick Chart
Tick chart of the price/spread/volume. Saves tick data in a file.
ClockAnalog
24-hour analog GMT(UTC) market clock displaying in background. The clock displays the Greenwich Mean Time and shows the status of all main stock exchanges according to their schedule.
Calc Profit Loss on LinePrice
The calculation of profit/loss in the deposit currency at the desired symbol price level on all open orders.