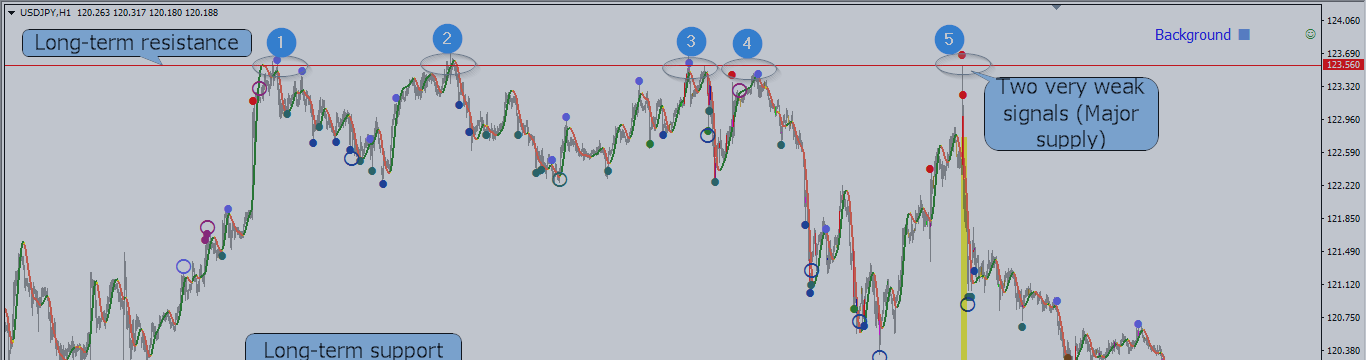
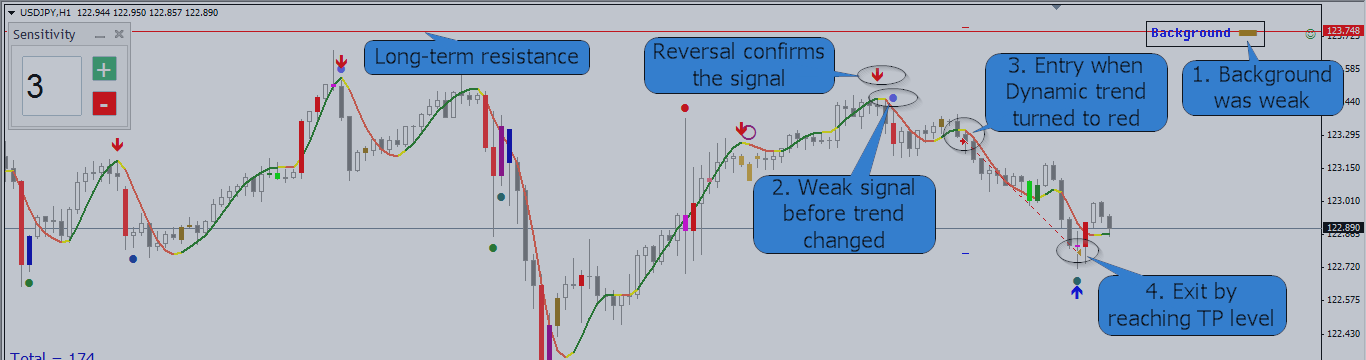
In a big picture (daily timeframe) USDJPY is moving upwards (Mark-up phase). You see that it is possible to draw an up-trendline with several touches (5 times market touched this line). In H1 timeframe we have 2 important levels: resistance and support. Long-term resistance...
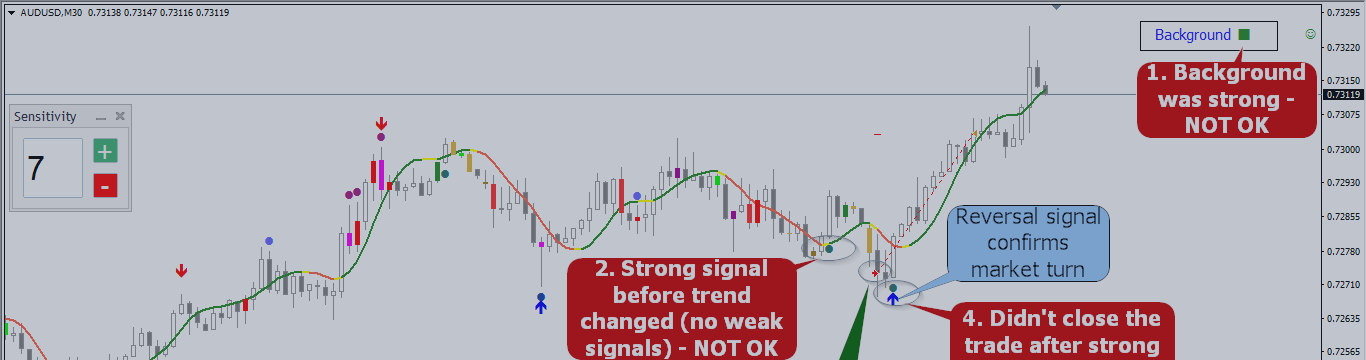
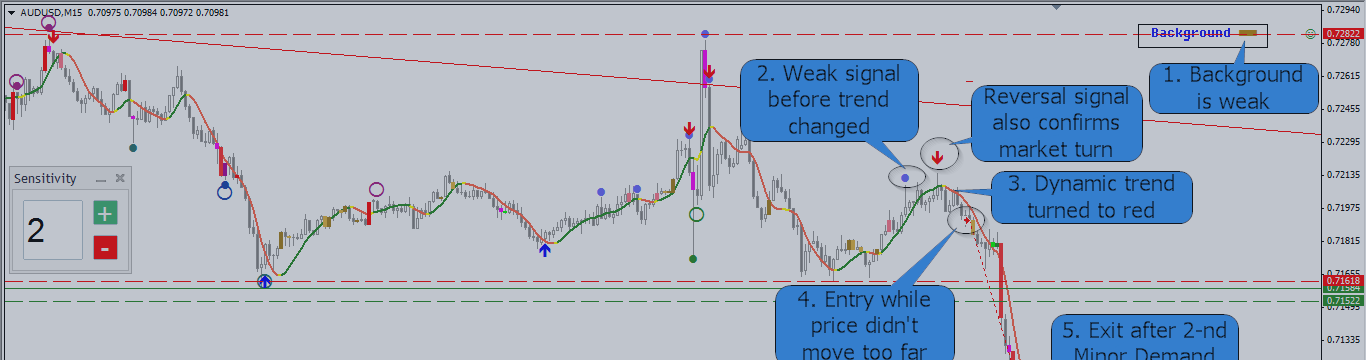
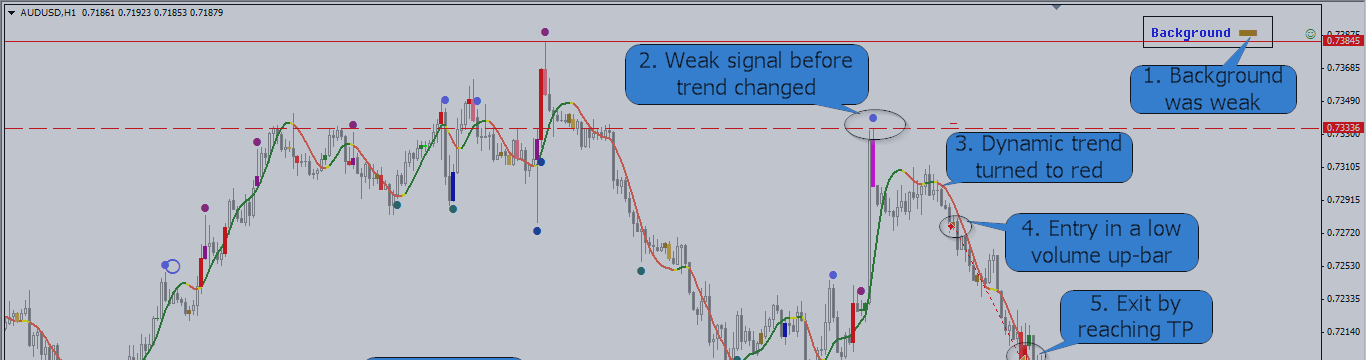
AUDUSD M30 Trade analysis: 1. At the time of entry background was strong – it is wrong to be bearish in this place. Only weak background is a sign that imbalance between supply and demand is in favor of supply. 2. Strong signal before trend changed. In addition, there is no weak signal...
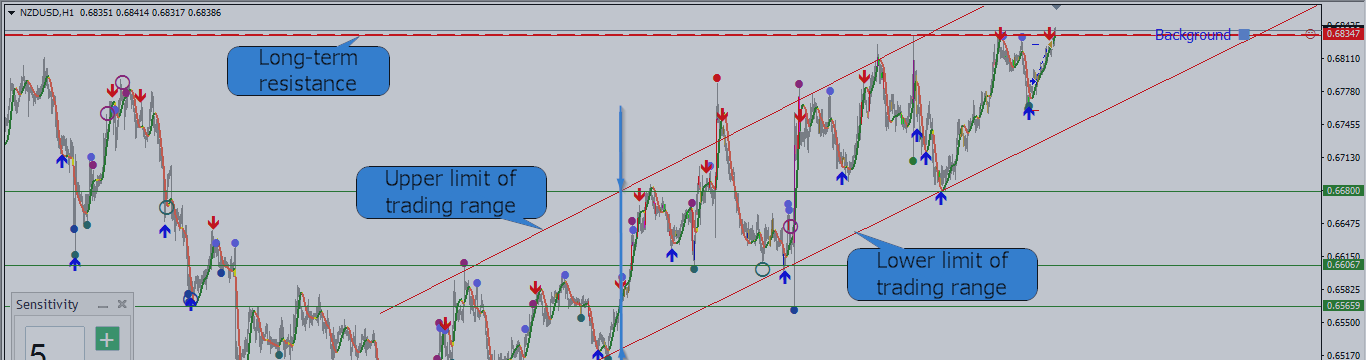
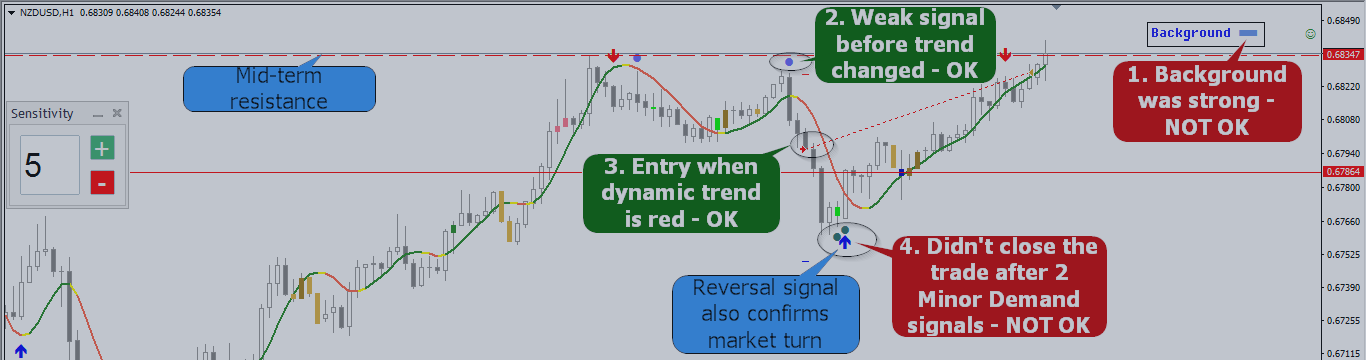
NZDUSD is moving in a trading range. The area between the upper and lower trend lines is known as the trading range. In VSA terms, the (sideways) market is trading within its range, and will continue to do so until applied (selling or buying) effort makes it break out...
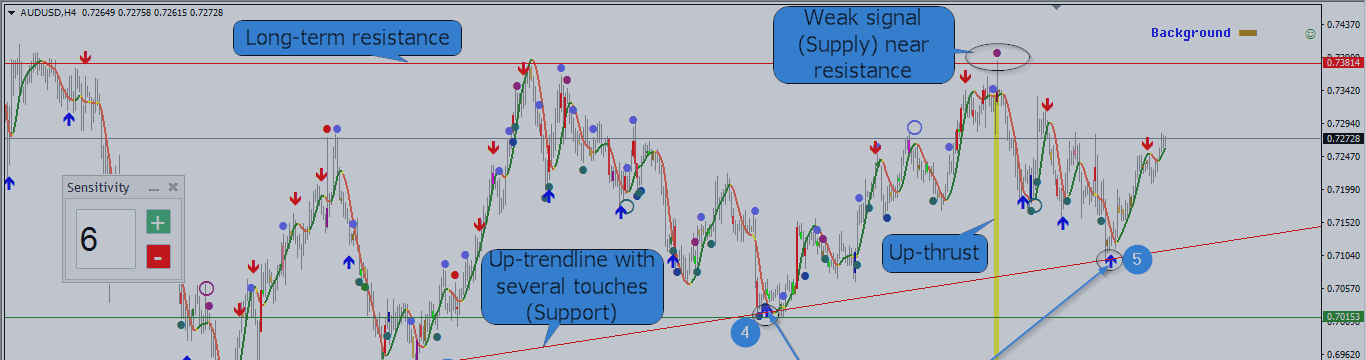
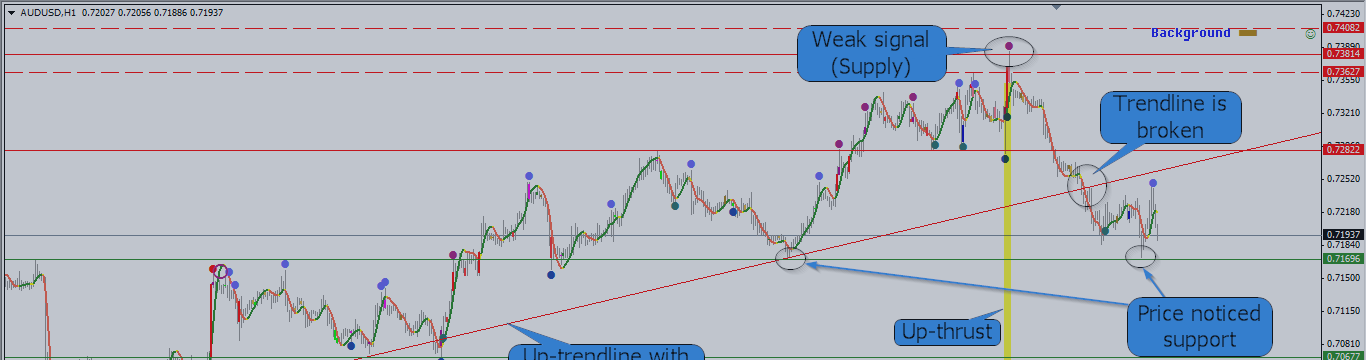
There is a very interesting pattern in AUDUSD chart. Movement is limited by two important lines: 1. Upper limit: long-term resistance On 04.12.15 we had high activity on the top of the market when price was near the level of previous high (look at the volume and spread). Then up-thrust happened...
NZDUSD H1 Trade analysis: At the time of entry background was strong – background didn’t have time to turn weak and it is wrong to go short in this case Weak signal (Minor Supply) before trend changed (moreover this signal appeared near mid-term resistance) – this is a correct setup for a short t...
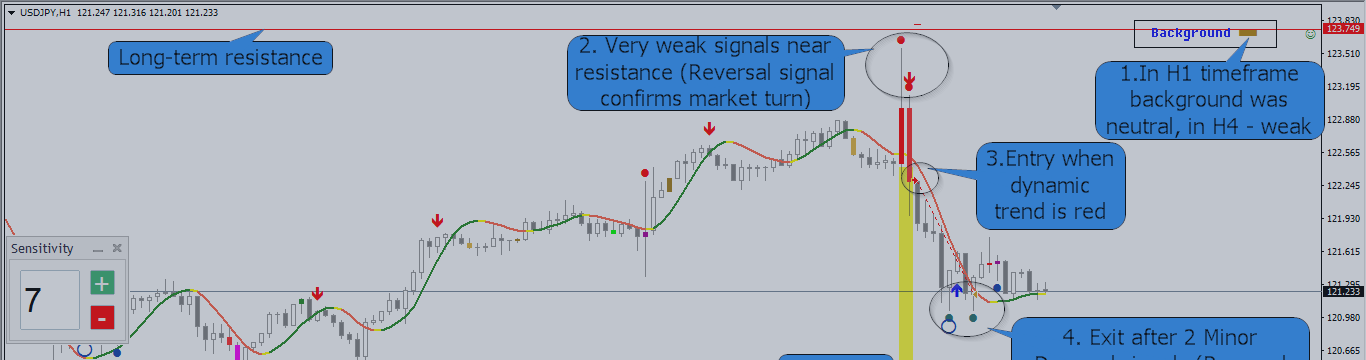
This is a near resistance trade which was opened after up-thrust in USDJPY. In this chart we have long-term resistance which was created by previous high. At first market was rising, than we had an up-thrust (2 wide spread bars with high volume...
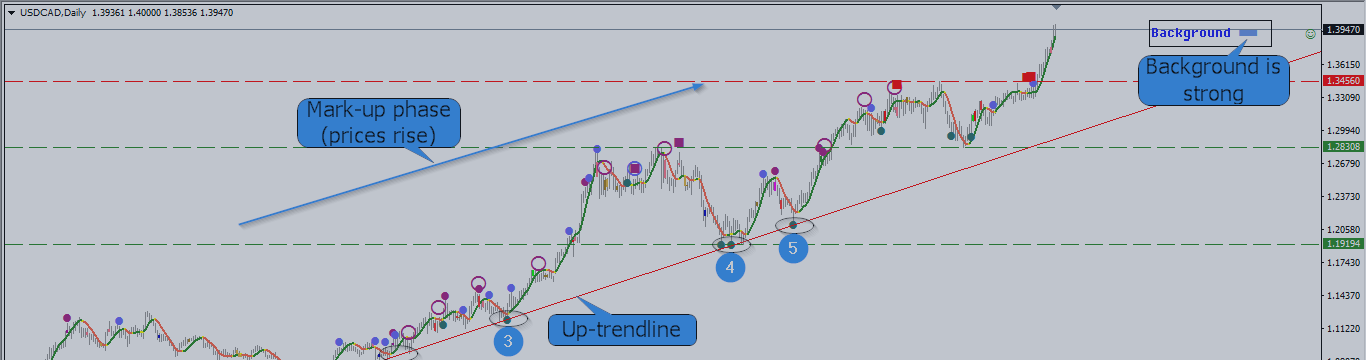
In daily timeframe it is obvious that USDCAD is moving in Mark-up phase (market is rising). Up-trendline is supporting the price (price turned near this line 5 times already). Background is strong...
AUDUSD was moving in descending triangle. It was possible to draw a down-trendline and market turned 4 times near this resistance. Lower limit of this triangle was a support line. Recently it was broken by wide spread down-bars with high volume...
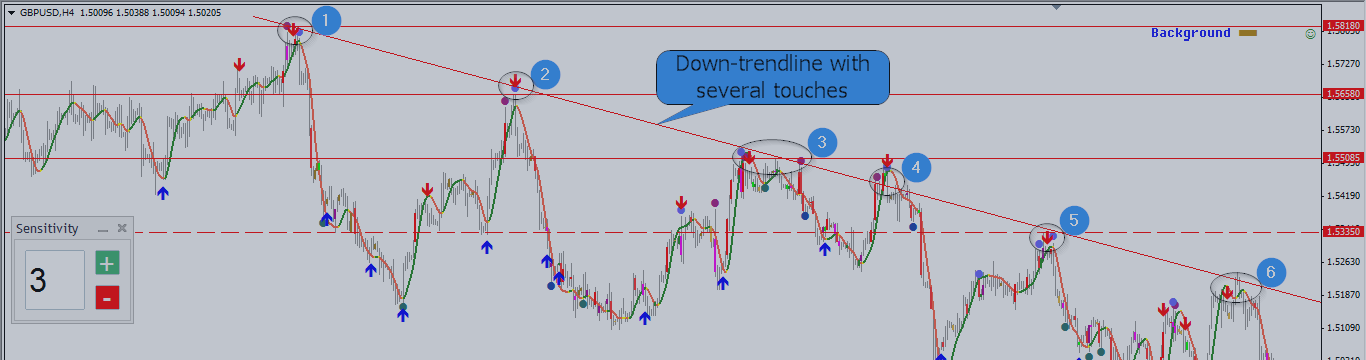
GBPUSD is moving down and it is possible to draw a down-trendline with several touches. Market already turned six times near this line. Therefore it represents resistance to higher prices...
This is a follow-up trade of AUDUSD analysis. The price has formed a wide spread up-bar on news. But according to previous analysis my view in the market was bearish and now prices were attractive for a short trade...
I would like to start this analysis from lower timeframe. AUDUSD was moving in up-trend and it was possible to draw an up-trendline with several touches supporting lows of each down move. On Friday (04.12.15) we had high activity on the top of the market (look at the volume and spread...
One more trade in USDJPY opened after previous analysis. As I discribed, the market is moving sideways and 123.74 – is a key level which represents resistance to higher prices. Again price changed direction near this resistance. I waited another signals and shorted the market. 1...
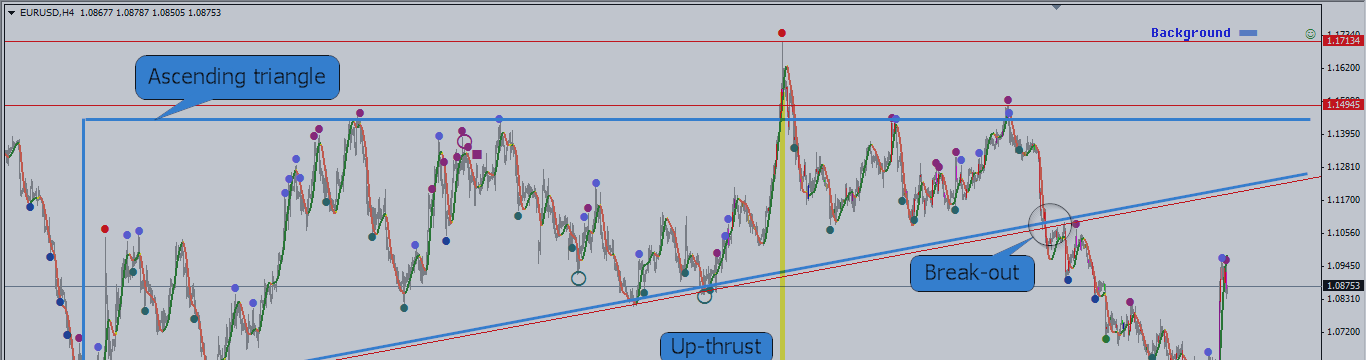
Earlier EURUSD was moving in ascending triangle and the price has broken the lower line of triangle. After the support was broken the price had no resistance and was falling during 1 month until it approached long term support which was created by previous low in March 2015...
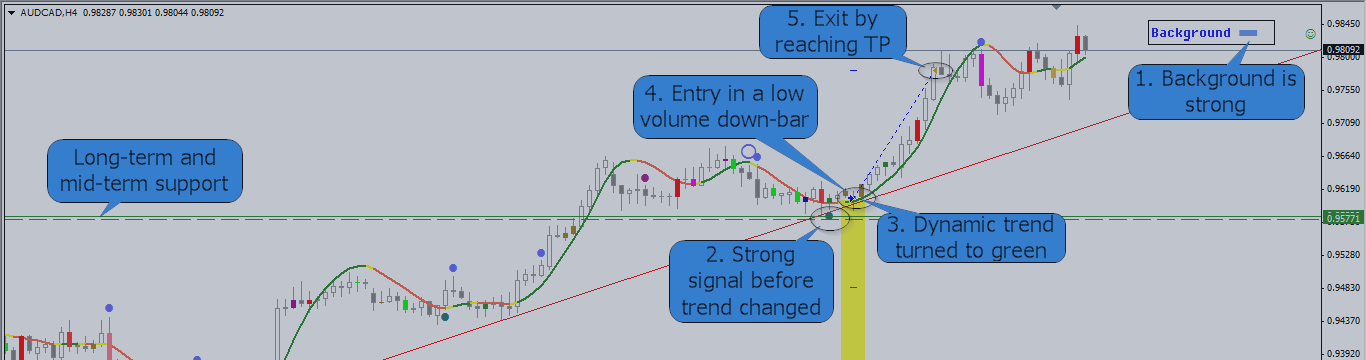
There are several important levels in AUDCAD H4: - Up-trendline. This is the line which represents support for the prices. As you see the market several times touched this line and price turned its direction. - Long-term and mid-term support (They are very close to each other...
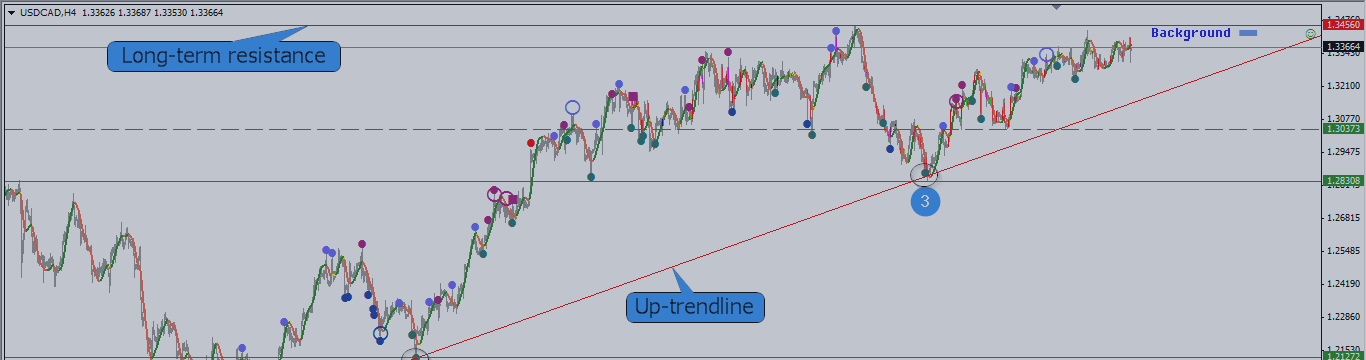
USDCAD was moving upward and it was possible to draw an up-trendline with several touches. After the price approached the point №3, Analytical Trader detected strong signal and the trendline worked as a support for the prices, market changed direction...
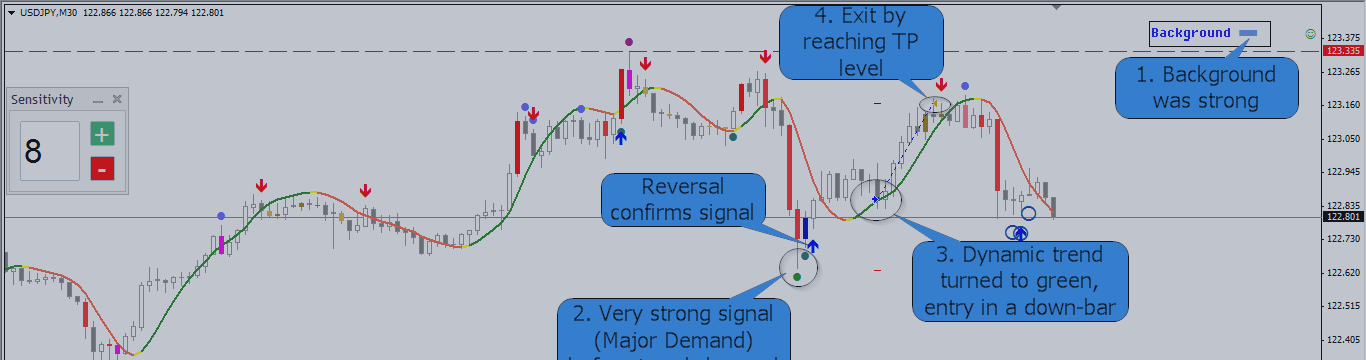
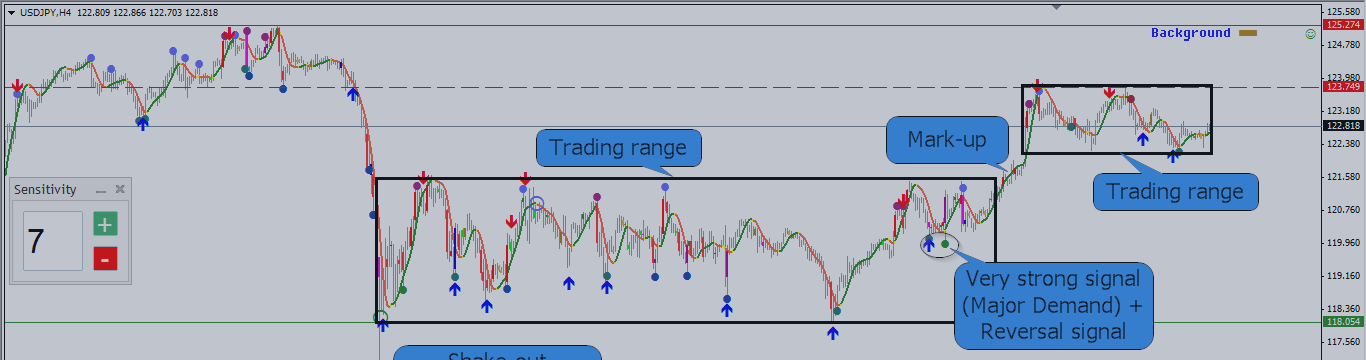
After near support reversal described in previous USDJPY analysis, price continued to rise and background turned to strong. The following trade was opened after very strong signal detected by VSA indicator. Reversal is also confirming these signals. 1. Background was strong. 2...
In USDJPY analysis at first I would like to discuss H4 timeframe. After the shake-out which was also a stopping volume for mark-down movement, the price started to move sideways within trading range. This was a wide trading range...