RSI Divergence F
- Indicators
- Andrey Dik
- Version: 1.80
- Updated: 12 July 2023
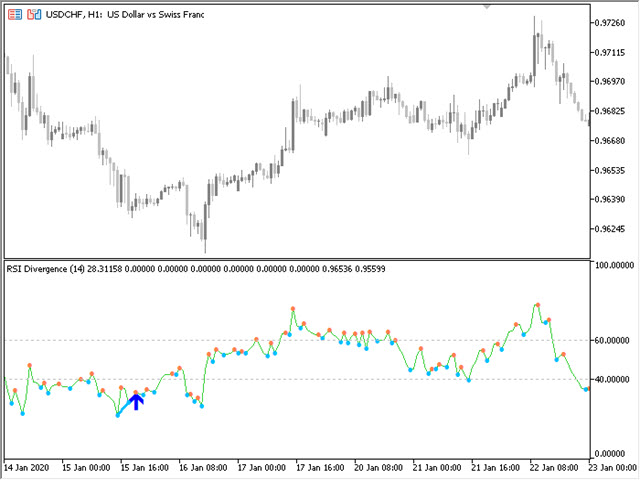
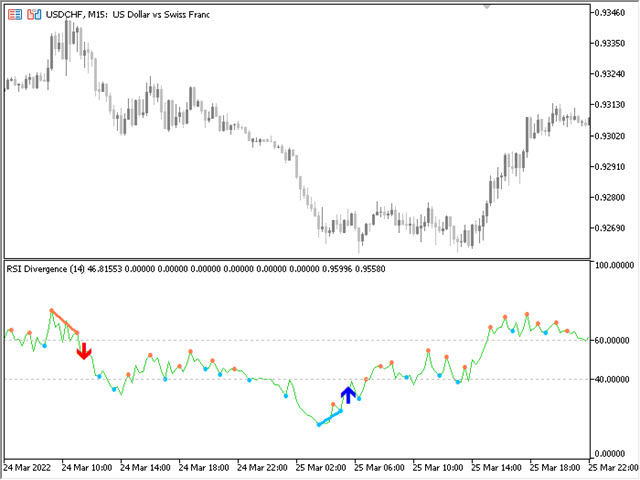
A professional tool for trading - the divergence indicator between the RSI and the price, which allows you to receive a signal about a trend reversal in a timely manner or catch price pullback movements (depending on the settings). The indicator settings allow you to adjust the strength of the divergence due to the angle of the RSI peaks and the percentage change in price, which makes it possible to fine-tune the signal strength. The indicator code is optimized and is tested very quickly as part of the Expert Advisor.
The indicator does not redraw, the arrows for the direction of transactions are located exactly where the signal appears - at the opening of the bar. The extremum points of the indicator are obtained by applying a fractal dimension, the depth of which is regulated by Left Bars, the larger it is, the greater the distance between the extremum points. Right Bars is not recommended to set more than 1, this is the minimum delay that is possible in principle. The basis for building Fractal True.
The flexibility of the settings makes it possible to build on different types of prices and to set different depths of building extremes.
PeriodRSI_P     = 14;          //Period
IndentFrom50_P  = 10.0;        //Indent +- from 50 [0...50]
LeftBars_P      = 1;           //LeftBars
RightBars_P     = 1;           //RightBars
IndDivForce_P   = 15.0;        //Divergences force of indicator (not for the Lite version)
PriceDivForce_P = 0.01;        //Divergences force of price (not for the Lite version)
Price_P         = PRICE_CLOSE; //Price type


Good if you know how to use it.