Market Ticker Pro MT5
- Indicators
- John Louis Fernando Diamante
- Version: 1.3
- Updated: 27 August 2021
- Activations: 5
The only Market Ticker on the market!
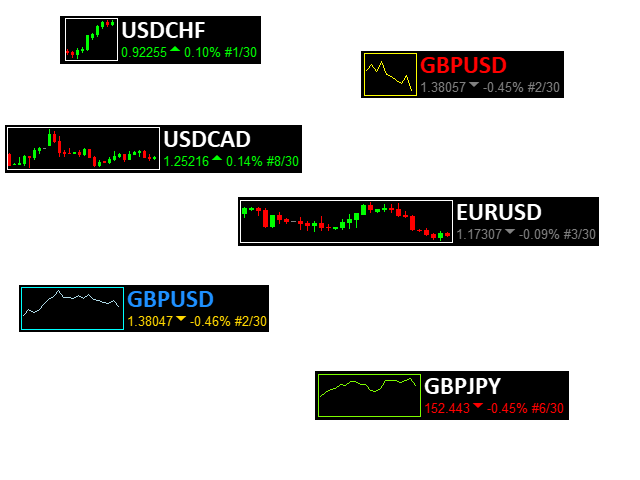
Add a professional novelty to your workspace, with built in mini-charts
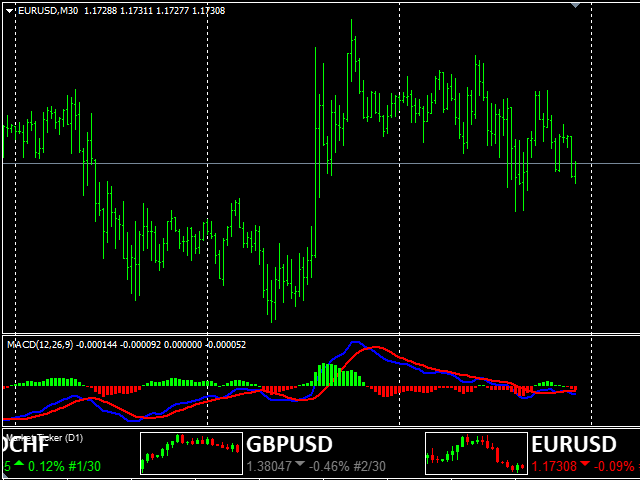
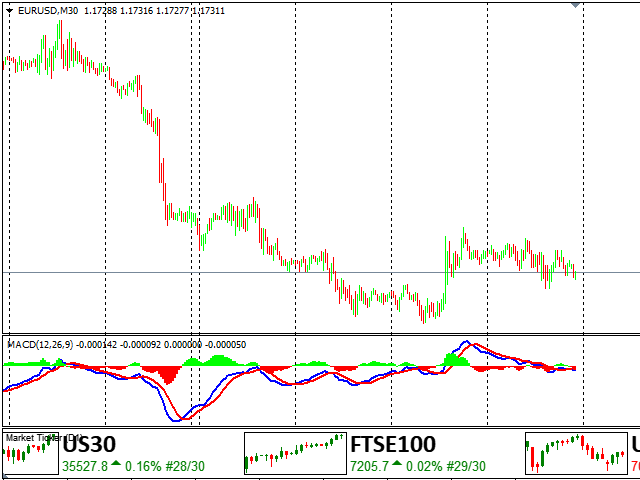
A scrolling Market Ticker that displays price changes from all symbols in the Market Watch list.
Provides an easy snapshot of symbol prices, and keeps scrolling automatically while you trade and analyse the chart.
The ticker color (+/- price changes) are based on either the current or completed candle, and the previous candle.
Options include:
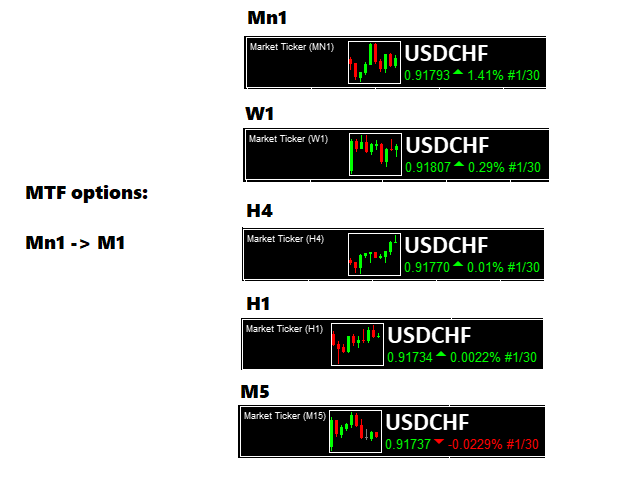
- MTF, eg choose to show price changes of the MN1, W1, D1, H1, H4, M30, M15, M5 or even M1
- option to use all symbols in market watch, or the top x
- use the live candle or the recently completed
- control ticker speed
- adjust number of candles in the mini chart
- mini chart as either full body candles or a line chart
- ticker styling
Troubleshooting:
If there are any issues or suggestions for the indicator, please comment and let me know. The feedback will be noted and considered in future products and updates.