EZT Macd Pro
- Indicators
- Tibor Rituper
- Version: 1.12
- Updated: 24 November 2021
- Activations: 10
You can read about the MACD indicator at this link
Software description
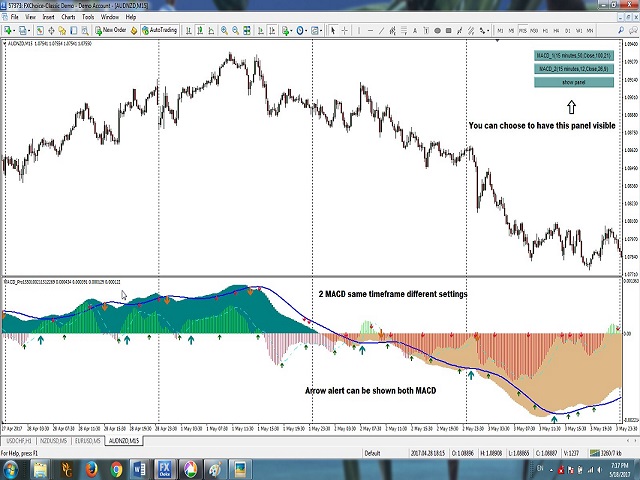
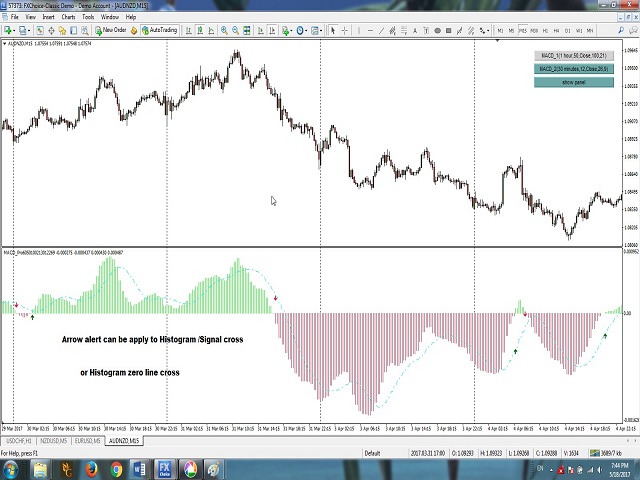
This indicator can display 1 or 2 MACD indicator on different time frames and settings. There is a FREE version that uses EMA for calculation. This Pro version use all 4 Moving average type for calculation: Simple, exponential, smoothed and linear weighted. The active indicators can give pop up, sound, push or e-mail alert. The free version alert on zero-level-cross only, this Pro version alert can be set to zero level cross or histogram-signal line cross if the user choose that option. Alert can be set on one or both active indicator, even if the time frame, and the period different on each. When 2 MACD indicator in use, alert can work separately on each one.
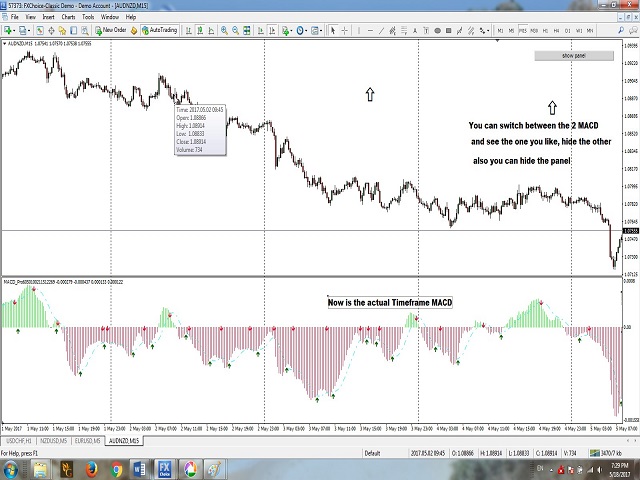
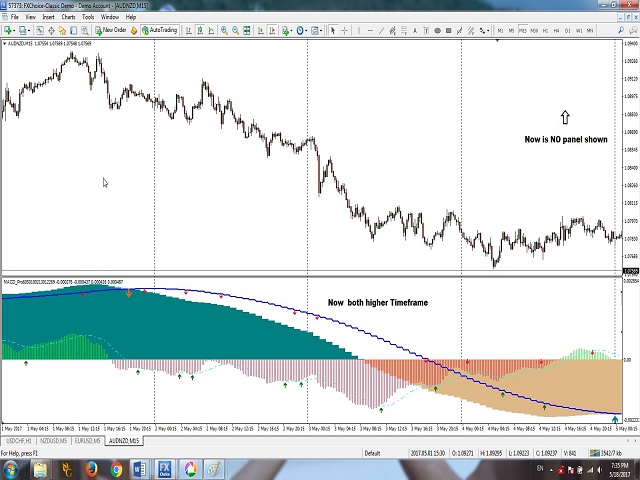
There is a display panel with buttons on the main chart, what is show the active indicators and their settings. There is an option to hide this panel. With the buttons temporary you can hide one of the active MACD
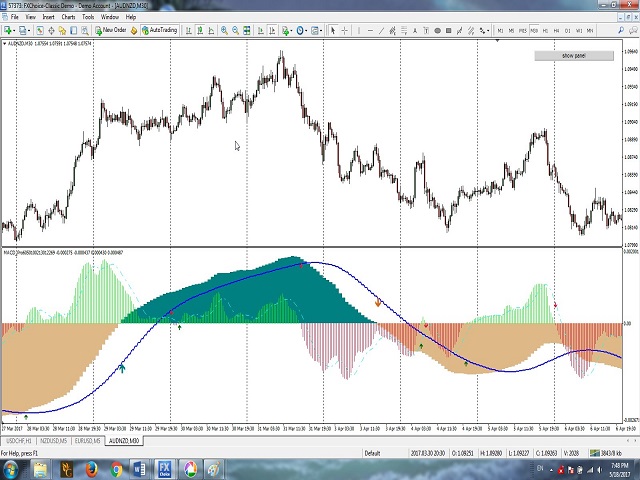
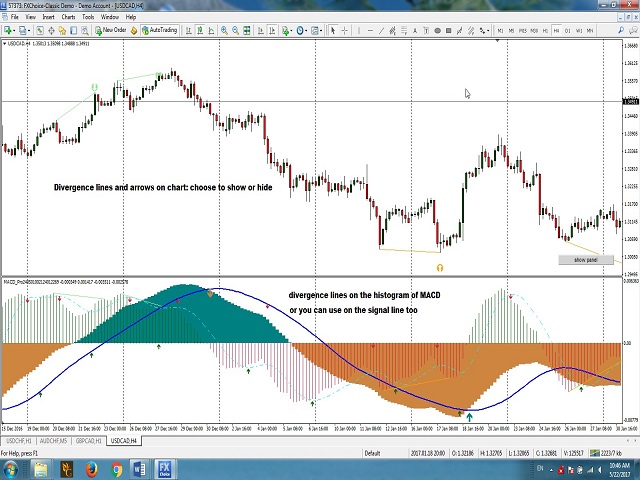
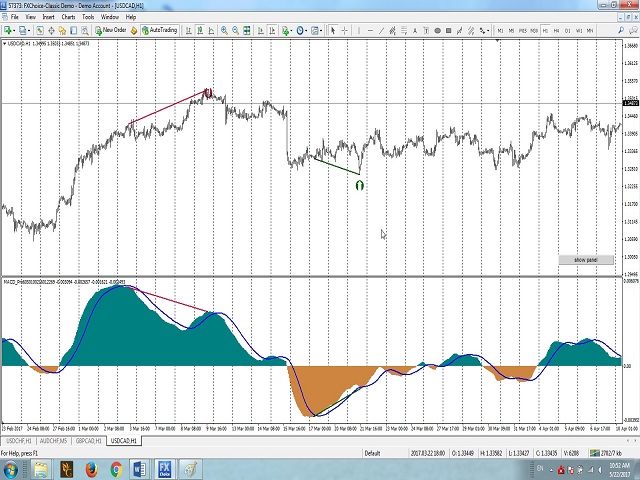
Added extra feature what the free version does not have: Divergence. You can choose to show Divergence on both MACD. You can choose regular or hidden divergence or you can have both. You can choose to have the divergence on the histogram or on the signal line. Also you can have the lines displayed only on the MACD sub window or in the Price chart and the MACD. On the price chart also you can display arrows for the divergence. You can set the alerts separately on the two type of divergence. Full customization for the colors and line thickness options.
Settings
- Panel location - The display panel on main chart, which corner you want to see it.
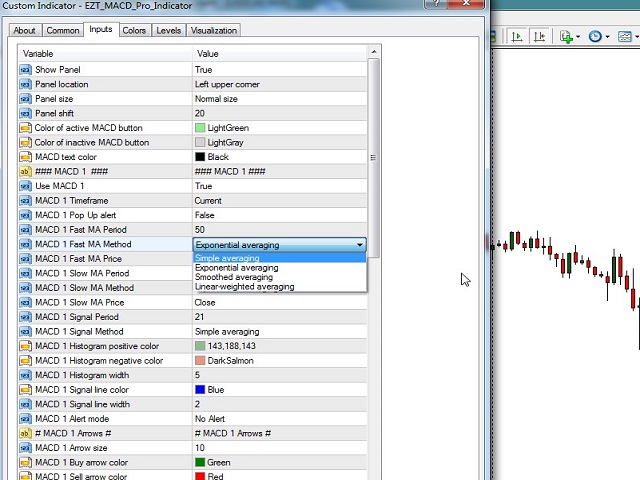
- Show Panel - true or false. Only Pro version have this option.
- Panel size - You can choose normal or large size.
- Panel shift - How far you want the panel from the side.
- Color of active MACD button - Active MACD.
- Color of inactive MACD button - Active MACD but temporary hidden.
- Use MACD - choose only one or both: true/false.
- MACD time frame - each MACD can be on a different timeframe.
- Alert - true/false: pop up alert on the arrow.
- MA method - Use any of the 4 moving averages: Simple, Exponential, Smoothed, Linear weighted / only Pro version.
- MA Price - Use any of the 7 types: Close, Open, High, Low, Median, Typical, Weighted.
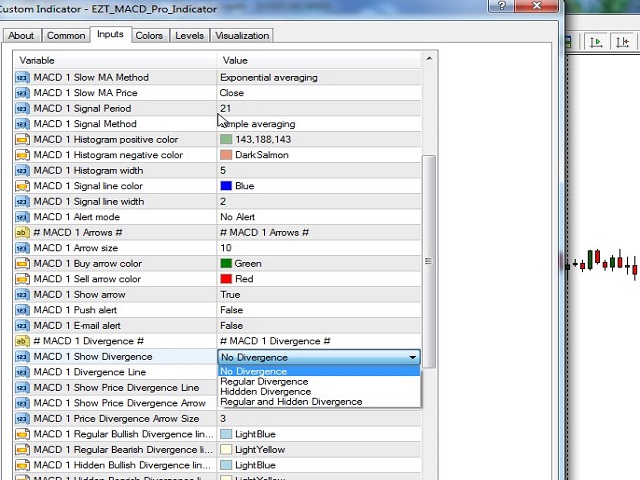
- MACD show Divergence - Choose your type: No divergence, Regular, Hidden, or both.
- MACD divergence line - Apply the divergence line to the histogram or to the signal line. Choose only one.
- Show Price divergence line - When set to true, the divergence line will be visible on the price chart also.
- Show price divergence arrow - When set to true, arrow on the price chart will show the divergence.
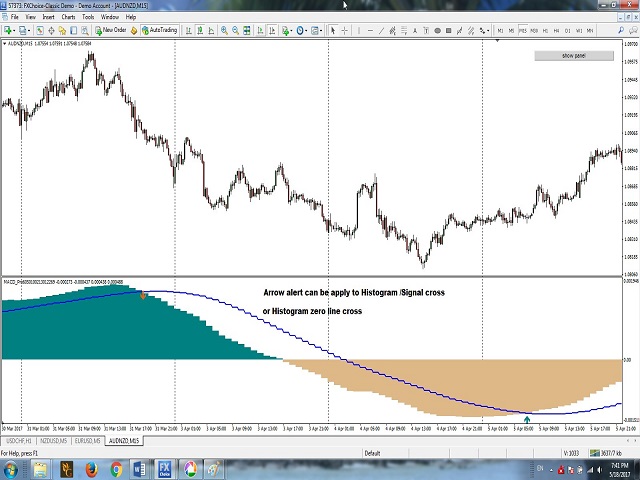
- Alert mode - You can set the alert for the histogram-zero line cross, or the histogram-signal line cross, or none. Choose your alert type.
please help my work by writing a rewiev or rating


after watching the indicator perform this week I can say that this is a very good indicator it help me verify on my direction regarding price movement great job.