Specification
I run between 10-20 MT4 terminals and I have EAs on each terminal that shows me a graph of balance, equity and P&L live, and per day back 10 days etc but I don't have an overall view of all the terminals combined. I'd like this built so I can connect to the page from mobile/desktop without logging in to each terminal.
MyFXbook and FXblue kinda do this job but they focus very much on Balance and not equity, but equity is what I need to focus on.
The job is to set up the host/server and build a website that takes the data from each terminal (or build an EA on the terminal that uploads the data) and creates a page with statistics of the overall (and detailed) position of all the accounts.
Alternative might be easier to scrape the MyFXbook or FXblue page of the portfolio and use the Equity balance, #lots etc and then build our page form that data. Mostly they have all this data on those pages.
here is what the page should display ....
--------------------------
For example (to updated every 1 min)
Current -5mins 60mins Start of Day
Total Balance $12,205 $12,110 $11,200 $11,504
Total Equity $11,200 $12,599 $12,444 $12,991
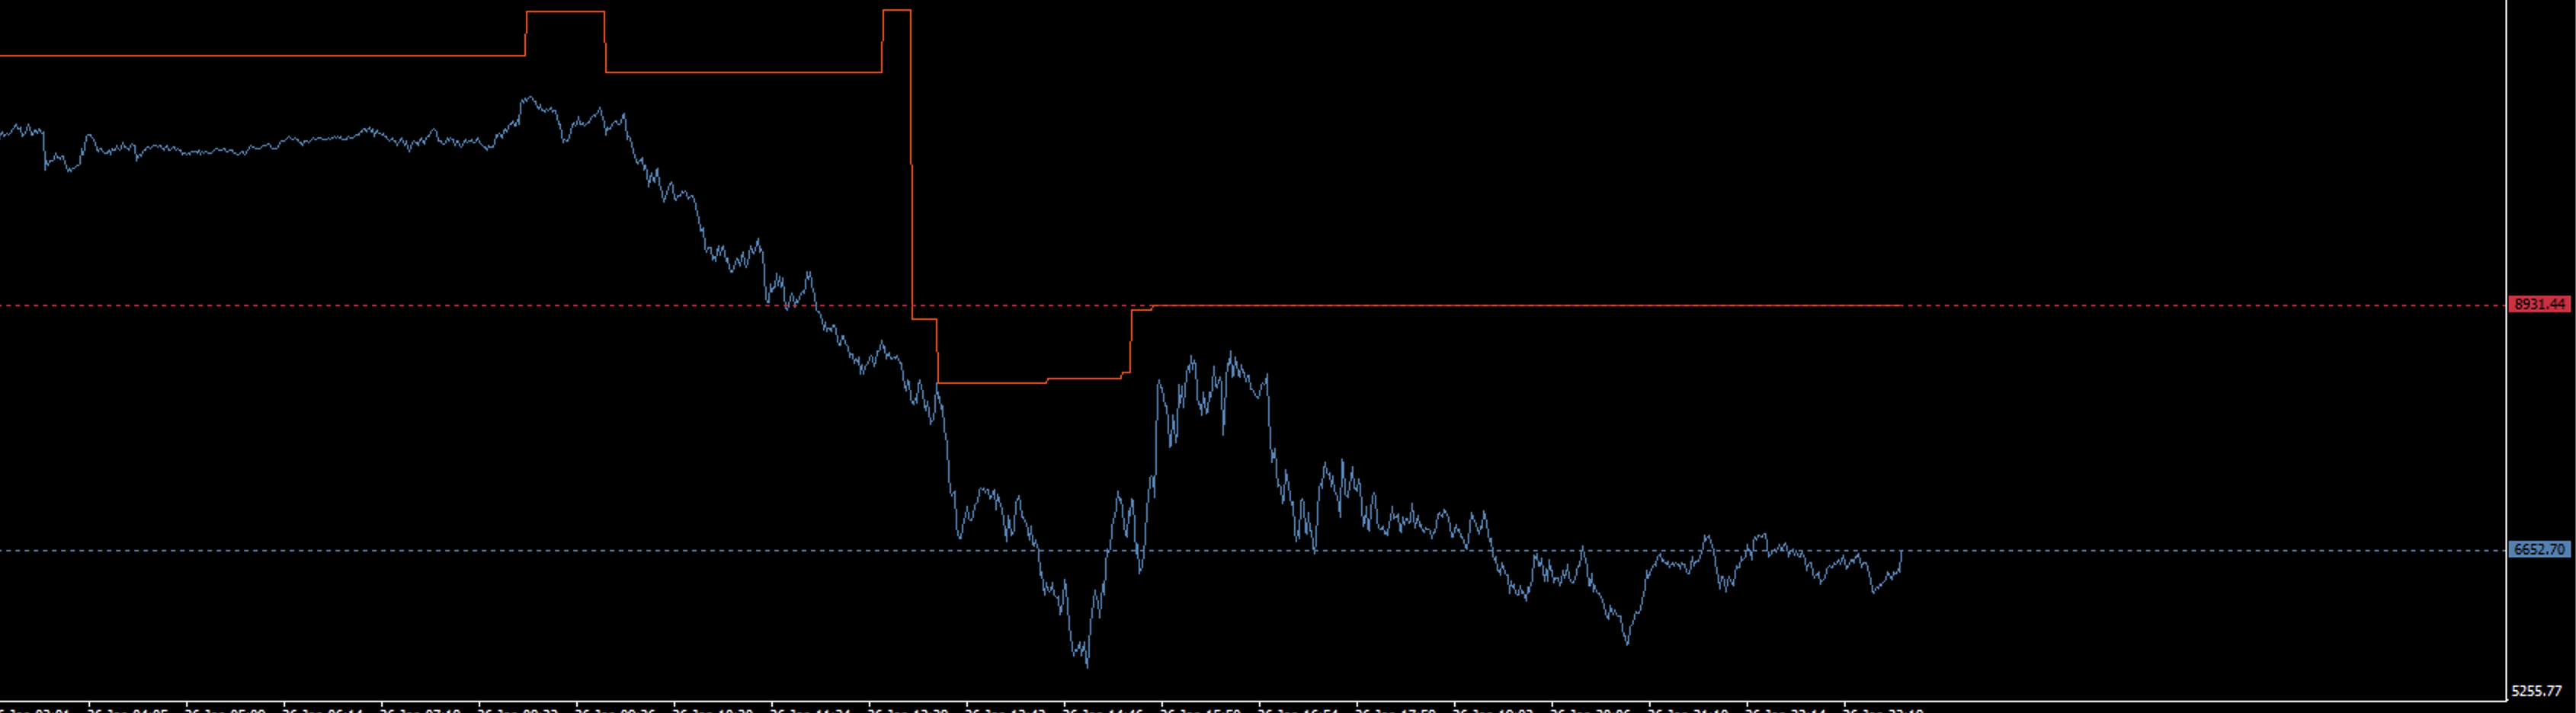
Line Graph of 1 min sample Balance back XX periods
Live Graph of 1 min samples Equity back XX period
Line Graph of # open positions
Line Graph of # open lots
--------------------------
Then to show data from Each individual account
------------------
Balance $value of account, -5min, -60mins, Start of Day
Equity accounts of account, -5min, -60mins, Start of Dat.
Total Open positions
Total Open Lots
Graph of Balance back XX periods
Graph of Equity back XX period
List of open positions
List of recent closed positions
---------------------
Work includes setting up web hosting or VPS with webserver. open to public but with login/password
we could add some other interesting info there but this is the basics.
Must be possible for me to add new accounts
Example of the graph by the EA on the local account attached.