Scripts: Correlation Gaps Trading AUDJPY CADJPY NZDJPY
I really wanted this strategy, I'm really really want to ask you about that can you make this code to fully automatically trade?
cuz I was looking for this logic for 1 years and now finally fount it...so happy...but I'm just have basic understand of MT 4 code.
If you let me know your e-mail, I will contact you asap!!
please...
For now the only implementation in an auto strategy I can think at is Spearman correlation. I had some unsuccessful attempts to make an EA, and I am still working on it.
Thank you for your message.
To calculate the Spearman correlation coefficient between two instruments, you would typically follow these steps:
-
Data Collection: Gather the data for both instruments. Ensure that for each observation, you have paired values from both instruments.
-
Ranking: Rank the data from each instrument separately. Assign ranks based on the order of values, with the smallest value receiving a rank of 1, the next smallest a rank of 2, and so on.
-
Calculate Differences: Calculate the differences between the ranks of corresponding pairs of values. If two values are tied, assign them the average of the ranks they would have received.
-
Square Differences: Square each of these differences.
-
Sum Squared Differences: Sum up all of the squared differences.
-
Calculate Spearman's Correlation Coefficient: Use the formula for Spearman's correlation coefficient, which is given by:
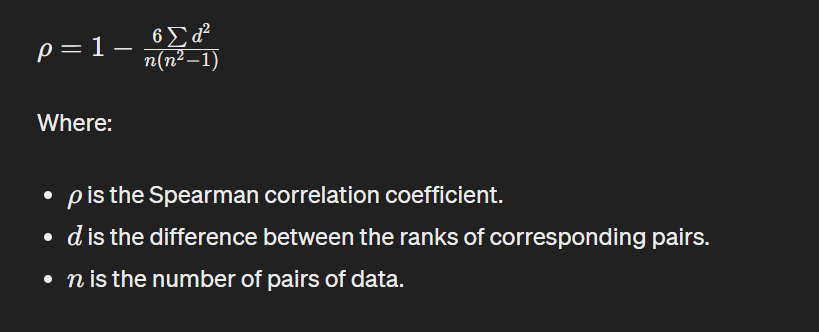
This formula adjusts for ties in the data and provides a measure of the strength and direction of the monotonic relationship between the two instruments.
- Interpretation: The Spearman correlation coefficient ranges from -1 to 1. A value close to 1 indicates a strong positive relationship (as one variable increases, the other tends to increase), a value close to -1 indicates a strong negative relationship (as one variable increases, the other tends to decrease), and a value around 0 indicates no monotonic relationship.
Remember, the Spearman correlation coefficient assesses the strength and direction of monotonic relationships, meaning that it can detect relationships that are not necessarily linear. It's often used when the data may not meet the assumptions of other correlation methods, such as Pearson correlation, due to non-normal distributions or outliers.
Let's assume we have the following data:
Instrument 1 (X): [10, 15, 20, 25, 30] Instrument 2 (Y): [8, 12, 18, 22, 28]
-
Ranking: For X: [1, 2, 3, 4, 5] For Y: [1, 2, 3, 4, 5]
-
Calculate Differences: Differences (d): [0, 0, 0, 0, 0]
-
Square Differences: Squared Differences: [0, 0, 0, 0, 0]
-
Sum Squared Differences: Sum of squared differences (Σd²): 0
-
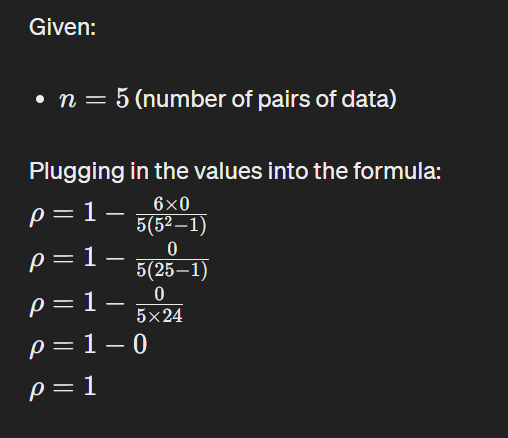
Calculate Spearman's Correlation Coefficient:
Given
-
Interpretation: The Spearman correlation coefficient (
ρ) is 1, indicating a perfect positive monotonic relationship between the two instruments. In this case, as the values of Instrument 1 increase, the values of Instrument 2 also increase in a perfect linear manner.
This example demonstrates how to calculate the Spearman correlation coefficient using specific data points for two instruments (X and Y).
- Free trading apps
- Over 8,000 signals for copying
- Economic news for exploring financial markets
You agree to website policy and terms of use
Correlation Gaps Trading AUDJPY CADJPY NZDJPY:
Short description.
Author: Iulian Persinaru