Machine learning in trading: theory, models, practice and algo-trading - page 2819
You are missing trading opportunities:
- Free trading apps
- Over 8,000 signals for copying
- Economic news for exploring financial markets
Registration
Log in
You agree to website policy and terms of use
If you do not have an account, please register
Yes, but it's not completely accurate. It's how I prefer to describe the current state and predict the future. These tasks are essentially the same. A change of state is a prediction, albeit a description of the present state))))
It's unequivocal. As long as there will be a comparison of an opa with a finger, I will no longer participate in the dialogue. Besides, I didn't start it.
Essentially future probability and state clustering are the same, what is the difference?
Essentially future probability and state clustering are the same, what is the difference?
It's going hard, isn't it? Raw probabilities without threshold vs clusters already with threshold
Actually, there is a similarity, a line is an average of patterns, yes, more is less, and how to characterise the movement? Only by the distance travelled, and the distance is only by the smallest distance, i.e. a grid. Yes, discrete entities are more complicated than continuous ones, but what we have is what we work with)).
I'd rather stream a toy. What else is there to do on a Saturday?
https://www.twitch.tv/gamearbuser
I have a kid who works part-time as a commentator at comp races)))). Well, and in real life on the kart too and skates himself))))))
I have a kid who works part-time as a commentator at comp races)))). Well, and in real life on the kart also and himself skates)))))
let him stream how he skates ) he will collect donations later.
set date
first 10 stock price information, if you want to create new features, if not they should be removed from the training.
last line - target
split the selection in half for traine and test
on the Forrest without any tuning I get on the new data
on hgbusta with the new features I got Akurashi 0.83.
I wonder if it is possible to achieve 0,9 Akurasi ?
No one has even touched it? (
I touched it just for fun.)
Used Random forest.
Variables not used:
X_OI
X_PER
X_TICKER
As requested, treyne and test in half.

I limited the maximum trees grown to 500.
MSE on traine for 500 trees grown
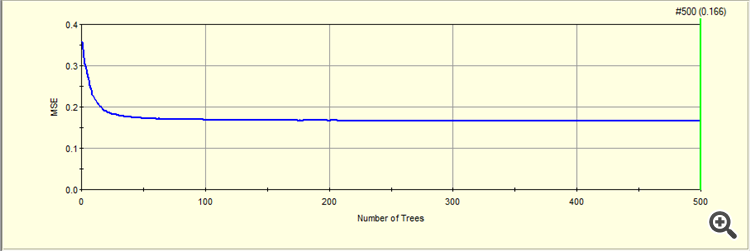
MSE on test for 500 grown trees
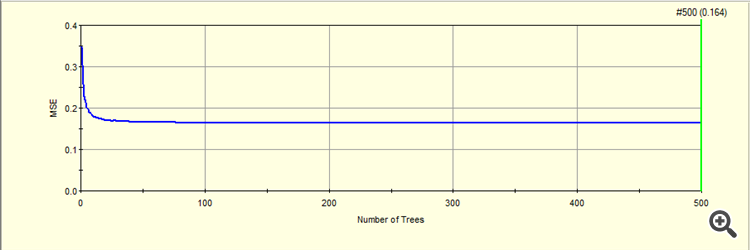
The resulting metric on traine(OOB) and on test.
Here I don't know how to bring your accuracy 0 ,77 Random forest to this metric.
Probably you should subtract MSE from one,
1- 0,16 = 0,84
Then you get the accuracy as you have on XGBoost )).
Well, and the variables that contribute to the training.
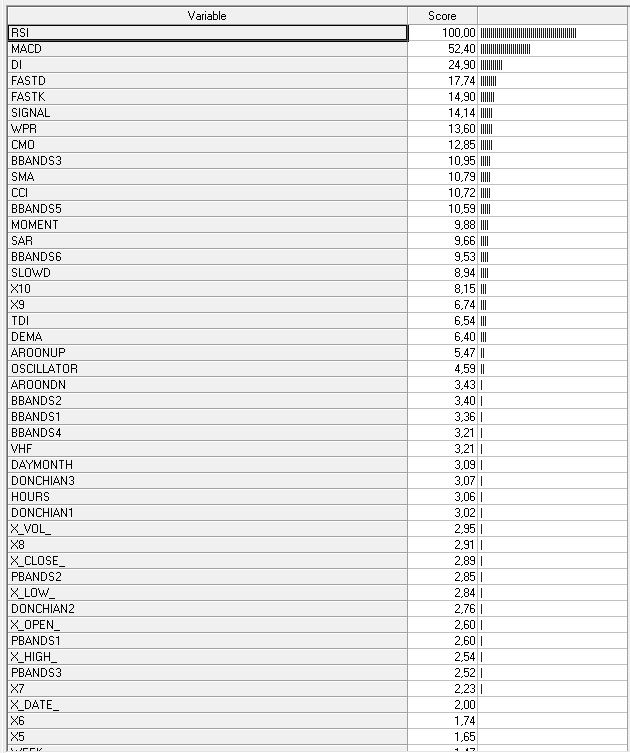
This is the kind of analysis I got )
I touched it just for fun )
Used Random forest.
Unused variables:
X_OI
X_PER
X_TICKER
As requested, track and test in half.
Well OHLC absolute prices should probably be thrown out too ) like I wrote )
MSE on trayne for 500 grown trees
MSE on test for 500 trees grown
The resulting metric on traine (OOB) and on test.
Here I don't know how to bring your accuracy 0 ,77 Random forest to this metric.
Probably MSE should be subtracted from one,
You're doing regression, you're doing classification! You've got it all wrong.
Well OHLC's absolute prices should probably be thrown out too ) as I write this
You're doing regression, you should be doing classification! You've got it all wrong there
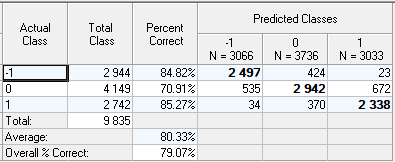
Here is the classification, without OHLC.
Accuracy is 0.79.

ROC test.

Confusion matrix.
Influencing variables
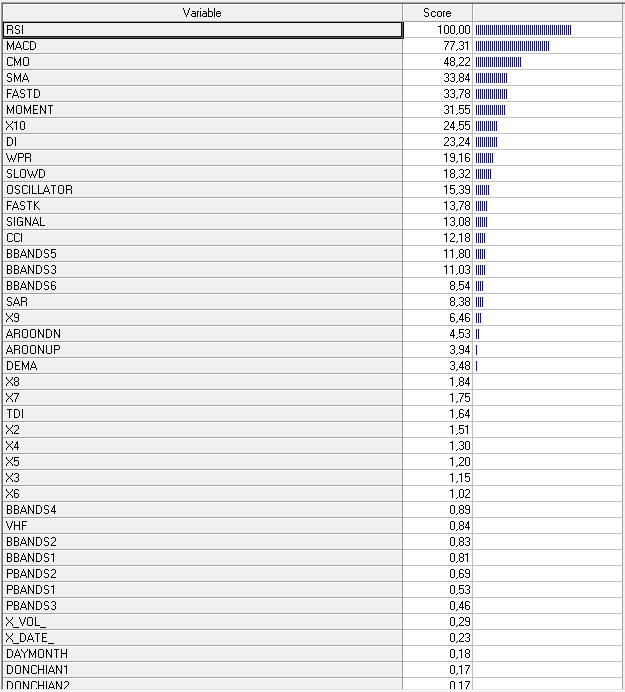
Gradient Boosting
on the trayne, the asscgasurises to 0.85

but on the test it drops to 0.75.
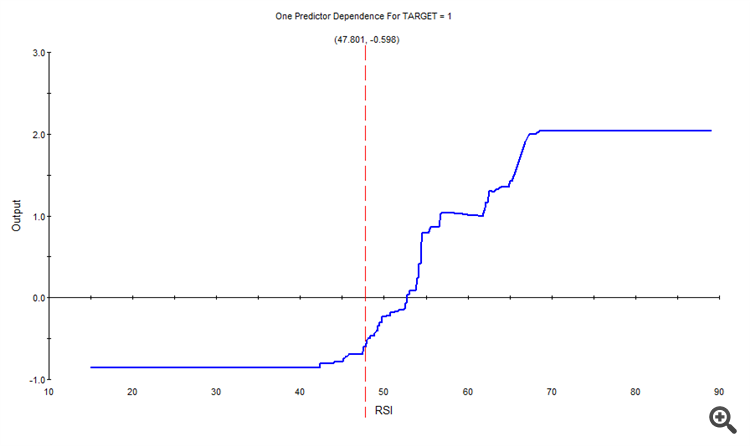
As an option to raise the assgassu, you can try to approximate the influence of significant variables, for each class -1, 0, 1
To use these splines as new variables.
For example for class 1, the influence of RSI was as follows
Approximated, we got a new spline.
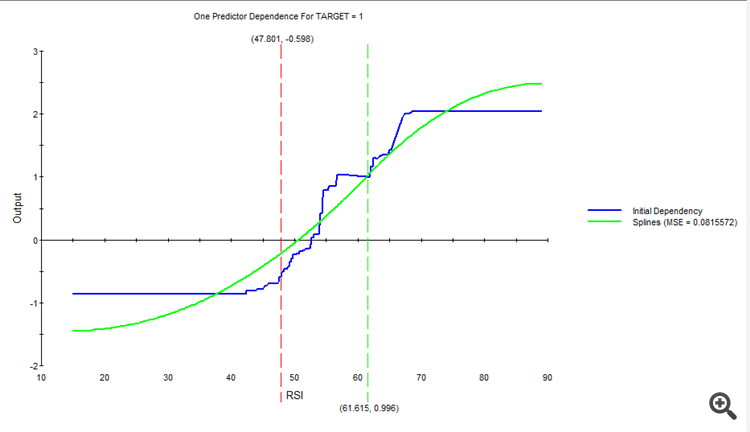
And so on, for each variable and each class.
As a result, a new set of splines will be obtained, which we feed to the input instead of the original variables.