Discussion of article "Econometric approach to finding market patterns: Autocorrelation, Heat Maps and Scatter Plots"
Greeting,
Thank you very much. The article was very insightful and helpful.
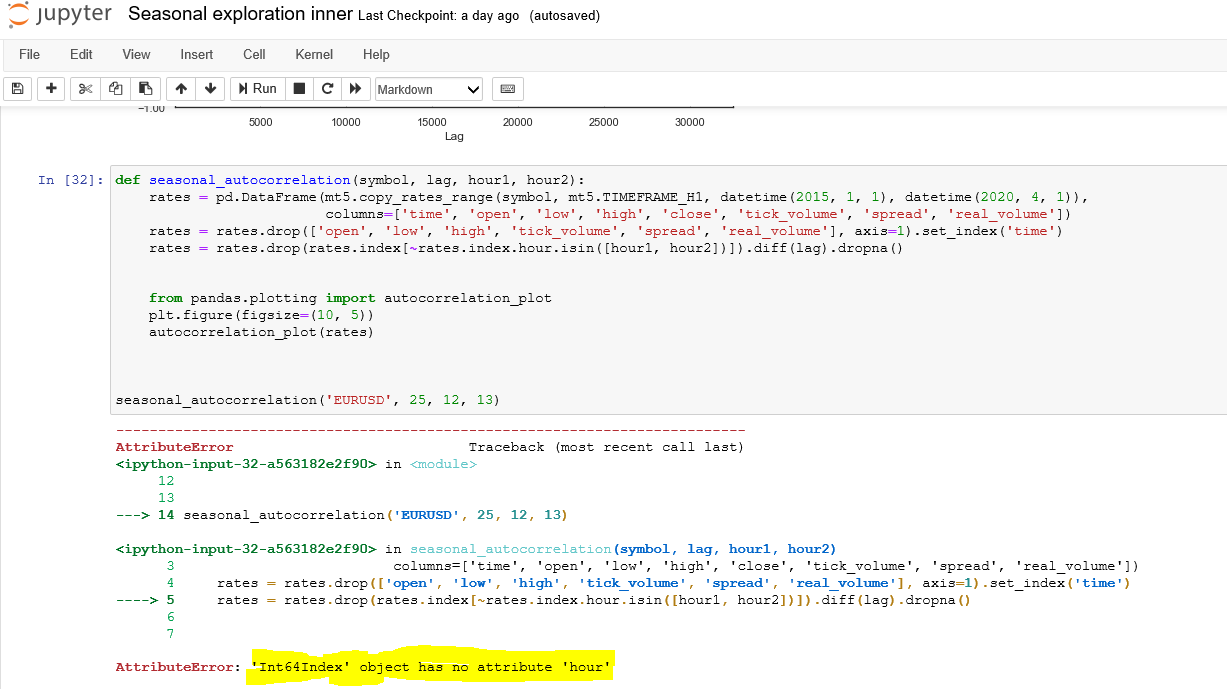
I face error while I try practice your code in jupyter Notebook (really thanks a lot for your supportive file),
---------------------------------------------------------------------------AttributeError Traceback (most recent call last) <ipython-input-32-a563182e2f90> in <module> 12 13 ---> 14 seasonal_autocorrelation('EURUSD',25, 12,13) <ipython-input-32-a563182e2f90> in seasonal_autocorrelation(symbol, lag, hour1, hour2) 3 columns=['time', 'open', 'low', 'high', 'close', 'tick_volume', 'spread', 'real_volume']) 4 rates = rates.drop(['open','low', 'high','tick_volume', 'spread','real_volume'], axis=1).set_index('time')----> 5 rates = rates.drop(rates.index[~rates.index.hour.isin([hour1, hour2])]).diff(lag).dropna() 6 7 AttributeError: 'Int64Index' object has no attribute 'hour'
Greeting,
Thank you very much. The article was very insightful and helpful.
I face error while I try practice your code in jupyter Notebook (really thanks a lot for your supportive file),
---------------------------------------------------------------------------AttributeError Traceback (most recent call last) <ipython-input-32-a563182e2f90> in <module> 12 13 ---> 14 seasonal_autocorrelation('EURUSD',25,12,13)<ipython-input-32-a563182e2f90> in seasonal_autocorrelation(symbol, lag, hour1, hour2) 3 columns=['time', 'open', 'low', 'high', 'close', 'tick_volume', 'spread', 'real_volume']) 4 rates = rates.drop(['open','low','high','tick_volume','spread','real_volume'], axis=1).set_index('time')----> 5 rates = rates.drop(rates.index[~rates.index.hour.isin([hour1, hour2])]).diff(lag).dropna() 6 7 AttributeError: 'Int64Index' object has no attribute 'hour'
Hi, MetaQuotes has change python API, so this functions not work now. Maybe later I'll fix this and attach a new notebook
Also, you can check new documentation on this site
Hi, MetaQuotes has change python API, so this functions not work now. Maybe later I'll fix this and attach a new notebook
Also, you can check new documentation on this site
Thanks A lot Mr, for your fast reply and your cooperation is highly appreciated
waiting for your new file.
Nice article! Thanks for sharing your work!
Hope you find some time to fix the issue with Python API.
/Rasoul
Thanks for your articles, I've really enjoyed reading them!
I noticed in this example you set the .diff(lag) after selecting the single hour throughout the article. Meaning that a lag of 25 actually corresponds to a lag of 25 days.
The exception is in the 3D plot where you apply the lag before selecting the hour. Was this intentional?
Oi
Vi que você entende bem de cointegração
Gostaria de perguntar se você sabe se esse indicador existe no mql5, ou quem criou a base para ele.
att
Cássio 
- Free trading apps
- Over 8,000 signals for copying
- Economic news for exploring financial markets
You agree to website policy and terms of use
New article Econometric approach to finding market patterns: Autocorrelation, Heat Maps and Scatter Plots has been published:
The article presents an extended study of seasonal characteristics: autocorrelation heat maps and scatter plots. The purpose of the article is to show that "market memory" is of seasonal nature, which is expressed through maximized correlation of increments of arbitrary order.
Let us perform an additional check on the M15 timeframe. Suppose we are looking for the same correlation between the current hour and the same hour of the previous day. In this case the effective lag must by 4 times larger and be about 24*4 = 96, because each hour contains four M15 periods. I have optimized the Expert Advisor with the same settings and with the M15 timeframe.
In the optimized interval, the resulting effective lag is <60, which is strange. Probably the optimizer found another pattern, or the EA was overoptimized.
Fig. 16. Relationship of the 'Lag' variable to the 'Order threshold' variable in the optimized interval
As for the forward test results, the effective lag is normal and corresponds to 100, which confirms the pattern.
Fig. 17. Relationship of the 'Lag' variable to the 'Order threshold' variable in the forward interval
Let us view the best backtest and forward results:
Author: Maxim Dmitrievsky