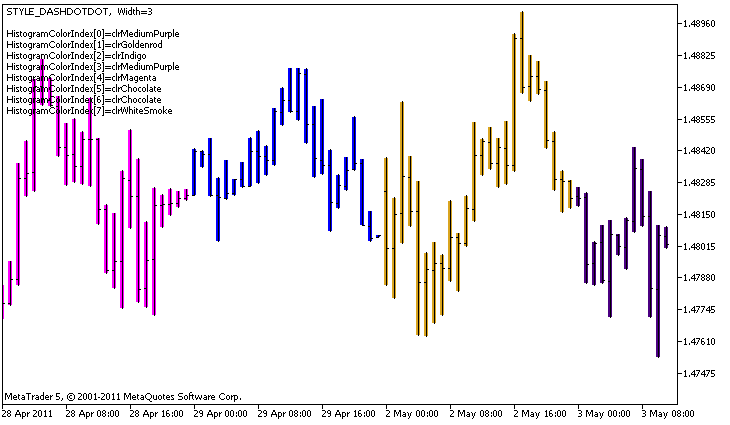
//+------------------------------------------------------------------+
//| DRAW_COLOR_HISTOGRAM2.mq5 |
//| Copyright 2011, MetaQuotes Software Corp. |
//| https://www.mql5.com |
//+------------------------------------------------------------------+
#property copyright "Copyright 2000-2024, MetaQuotes Ltd."
#property link "https://www.mql5.com"
#property version "1.00"
#property description "An indicator to demonstrate DRAW_COLOR_HISTOGRAM2"
#property description "It draws a segment between Open and Close on each bar"
#property description "The color, width and style are changed randomly"
#property description "after every N ticks"
#property indicator_chart_window
#property indicator_buffers 3
#property indicator_plots 1
//--- plot ColorHistogram_2
#property indicator_label1 "ColorHistogram_2"
#property indicator_type1 DRAW_COLOR_HISTOGRAM2
//--- Define 5 colors for coloring the histogram based on the days of week (they are stored in the special array)
#property indicator_color1 clrRed,clrBlue,clrGreen,clrYellow,clrMagenta
#property indicator_style1 STYLE_SOLID
#property indicator_width1 1
//--- input parameter
input int N=5; // The number of ticks to change the histogram
int color_sections;
//--- Value buffers
double ColorHistogram_2Buffer1[];
double ColorHistogram_2Buffer2[];
//--- A buffer of color indexes
double ColorHistogram_2Colors[];
//--- An array for storing colors contains 14 elements
color colors[]=
{
clrRed,clrBlue,clrGreen,clrChocolate,clrMagenta,clrDodgerBlue,clrGoldenrod,
clrIndigo,clrLightBlue,clrAliceBlue,clrMoccasin,clrWhiteSmoke,clrCyan,clrMediumPurple
};
//--- An array to store the line styles
ENUM_LINE_STYLE styles[]={STYLE_SOLID,STYLE_DASH,STYLE_DOT,STYLE_DASHDOT,STYLE_DASHDOTDOT};
//+------------------------------------------------------------------+
//| Custom indicator initialization function |
//+------------------------------------------------------------------+
int OnInit()
{
//--- indicator buffers mapping
SetIndexBuffer(0,ColorHistogram_2Buffer1,INDICATOR_DATA);
SetIndexBuffer(1,ColorHistogram_2Buffer2,INDICATOR_DATA);
SetIndexBuffer(2,ColorHistogram_2Colors,INDICATOR_COLOR_INDEX);
//--- Set an empty value
PlotIndexSetDouble(0,PLOT_EMPTY_VALUE,0);
//---- The number of colors to color the sinusoid
color_sections=8; // See a comment to #property indicator_color1
//---
return(INIT_SUCCEEDED);
}
//+------------------------------------------------------------------+
//| Custom indicator iteration function |
//+------------------------------------------------------------------+
int OnCalculate(const int rates_total,
const int prev_calculated,
const datetime &time[],
const double &open[],
const double &high[],
const double &low[],
const double &close[],
const long &tick_volume[],
const long &volume[],
const int &spread[])
{
static int ticks=0;
//--- Calculate ticks to change the style, color and width of the line
ticks++;
//--- If a critical number of ticks has been accumulated
if(ticks>=N)
{
//--- Change the line properties
ChangeLineAppearance();
//--- Change the colors used to draw the histogram
ChangeColors(colors,color_sections);
//--- Reset the counter of ticks to zero
ticks=0;
}
//--- Calculate the indicator values
int start=0;
//--- To get the day of week by the open price of each bar
MqlDateTime dt;
//--- If already calculated during the previous starts of OnCalculate
if(prev_calculated>0) start=prev_calculated-1; // set the beginning of the calculation with the last but one bar
//--- Fill in the indicator buffer with values
for(int i=start;i<rates_total;i++)
{
TimeToStruct(time[i],dt);
//--- value
ColorHistogram_2Buffer1[i]=high[i];
ColorHistogram_2Buffer2[i]=low[i];
//--- Set the color index according to the day of week
int day=dt.day_of_week;
ColorHistogram_2Colors[i]=day;
}
//--- Return the prev_calculated value for the next call of the function
return(rates_total);
}
//+------------------------------------------------------------------+
//| Changes the color of line segments |
//+------------------------------------------------------------------+
void ChangeColors(color &cols[],int plot_colors)
{
//--- The number of colors
int size=ArraySize(cols);
//---
string comm=ChartGetString(0,CHART_COMMENT)+"\r\n\r\n";
//--- For each color index define a new color randomly
for(int plot_color_ind=0;plot_color_ind<plot_colors;plot_color_ind++)
{
//--- Get a random value
int number=MathRand();
//--- Get an index in the col[] array as a remainder of the integer division
int i=number%size;
//--- Set the color for each index as the property PLOT_LINE_COLOR
PlotIndexSetInteger(0, // The number of a graphical style
PLOT_LINE_COLOR, // Property identifier
plot_color_ind, // The index of the color, where we write the color
cols[i]); // A new color
//--- Write the colors
comm=comm+StringFormat("HistogramColorIndex[%d]=%s \r\n",plot_color_ind,ColorToString(cols[i],true));
ChartSetString(0,CHART_COMMENT,comm);
}
//---
}
//+------------------------------------------------------------------+
//| Changes the appearance of a displayed line in the indicator |
//+------------------------------------------------------------------+
void ChangeLineAppearance()
{
//--- A string for the formation of information about the line properties
string comm="";
//--- A block for changing the width of the line
int number=MathRand();
//--- Get the width of the remainder of integer division
int width=number%5; // The width is set from 0 to 4
//--- Set the color as the PLOT_LINE_WIDTH property
PlotIndexSetInteger(0,PLOT_LINE_WIDTH,width);
//--- Write the line width
comm=comm+" Width="+IntegerToString(width);
//--- A block for changing the style of the line
number=MathRand();
//--- The divisor is equal to the size of the styles array
int size=ArraySize(styles);
//--- Get the index to select a new style as the remainder of integer division
int style_index=number%size;
//--- Set the color as the PLOT_LINE_COLOR property
PlotIndexSetInteger(0,PLOT_LINE_STYLE,styles[style_index]);
//--- Write the line style
comm=EnumToString(styles[style_index])+", "+comm;
//--- Show the information on the chart using a comment
Comment(comm);
}
|
