")

1. The Theory - How to Use Indicator
Developed by Marc Chaikin
This an oscillator Indicator, it measure the Accumulation/distribution of money that is flowing into and out of a currency pair. The indicator is based on the fact that the nearer the closing price is to the high of the price, the more the accumulation of the currency pair. Also the nearer the closing price is to the low of the price, the more the distribution of the currency pair.
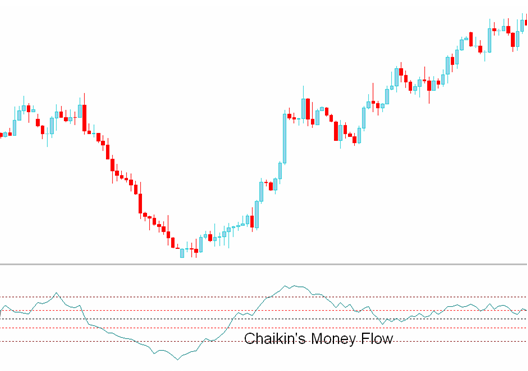
This indicator will be positive if price consistently closes above the bar's midpoint with increasing volume.
However, if price consistently closes below the bar's midpoint with increasing volume the indicator will be negative.
Technical Analysis of Chaikin Oscillator
Buy Signal
A crossover of above zero signifies accumulation of a currency pair. A
value of above +10 is a buy/bullish signal. Values above +20 signify a
strong upward trending market.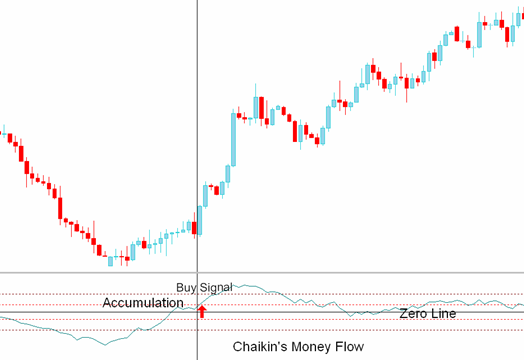
Sell Signal
A Zero line cross of below zero signifies
distribution of a currency pair. A value of below -10 is a short/sell
signal. Values below -20 signify a strong downward trending market.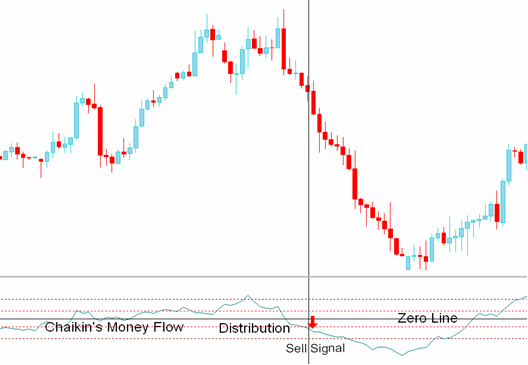
Trend Line break with Chaikin’s money flow indicator
The money flow indicator can be used to confirm trend line breaks or support/resistance level breaks. If price breaks an upward trend line, forex traders should then wait
for a confirmation signal from the indicator values of below -10.
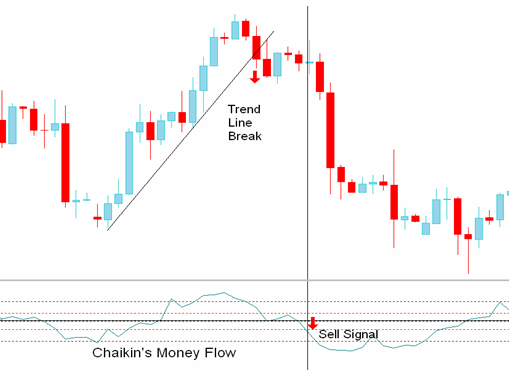
If price breaks an downward trend line, forex traders should then wait
for a confirmation signal from indicator values of above +10.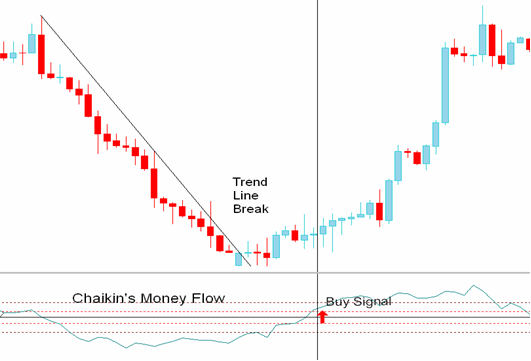
Divergence Trading
A divergence between the Money Flow indicator and price often signals a pending reversal in market direction. However as with all divergences its best to wait for confirmation signals before trading the divergence. A bullish divergence signal occurs when price makes a lower low while the Chaikin Money Flow indicator makes a higher low. Bearish divergence signal occurs when price makes a higher high while the Chaikin Money Flow indicator makes a lower high.
2. Practical Example
The Chaikin Oscillator or Volume Accumulation Oscillator consists of the difference between two exponential moving averages (usually 3 and 10-day) of the Accumulation Distribution Line indicator and is used to confirm price movement or divergences in price movement. The Chaikin Oscillator is more accurate than the On Balance Volume indicator.
- On Balance Volume: adds all volume for the day if the close is positive, even if the stock closed only a penny higher or subtracts all volume for the day if the stock closes lower.
- Chaikin Oscillator: factors in the closing price in relation to the highs, lows, and average price and determines the appropriate ratio of volume to be attributed to the day.
The main purpose of the Chaikin Oscillator is to confirm price trends and
warn of impending price reversals. The chart below of the Nasdaq 100 ETF QQQQ
illustrates these confirmation signals and divergence signals:
High #1 to High #2
The Nasdaq 100 ETF QQQQ made higher highs, usually a bullish sign. However, the Chaikin Oscillator failed to mirror the QQQQ's advance higher and ended up making a lower low. This bearish divergence forewarned of the impending price reversal.
High #2 to High #3The QQQQ's made a significantly lower high. The Chaikin Oscillator confirmed the QQQQ's downtrend by making a lower high as well.
Low #1 to Low #2The Nasdaq 100 made significant lower lows, yet the Chaikin Oscillator made higher lows. This bullish divergence signaled that the previous downtrend may have ended.
The Chaikin Oscillator is a helpful volume based technical indicator that helps confirm the current price action or foreshadow future price reversals. Other technical indicators similar to the Chaikin Oscillator is the On Balance Volume indicator
3. Download Indicator from CodeBase here


