Advice on how to earn 1'000'000 which is better than a million tips on how to earn (receiving 521’429% per annum).
continuation
The financial market is not a place where you need to come with a million in the hope of leaving with two, it will never happen, because everything you come with will remain there. The financial market is a place where you need to come only with knowledge, relevant skills and enormous experience in order to trade as much as you need.
Let’s take a starting deposit with the minimum possible size of 3 USD and try to increase it by trading on a nano-account with the minimum possible lot of 0.01 lot.
One of the most volatile and most liquid financial instruments in the financial market is gold (XAU/USD). That is why gold was chosen as a financial instrument for trading in order to obtain the highest possible profitability in a short period of time.
You can get acquainted with the analysis of the global fractal structure of the gold price dynamics chart by clicking on the link in the article “Gold. "Поехали!"".
Before you start trading gold, you need to conduct a detailed analysis of the fractal structures of all orders of the quote dynamics chart, model the possible future dynamics of quotes, assess the probabilities of the implementation of the compiled models, develop a trading strategy and tactics in accordance with the models, and only after that start making transactions in strict in accordance with the planned plan.
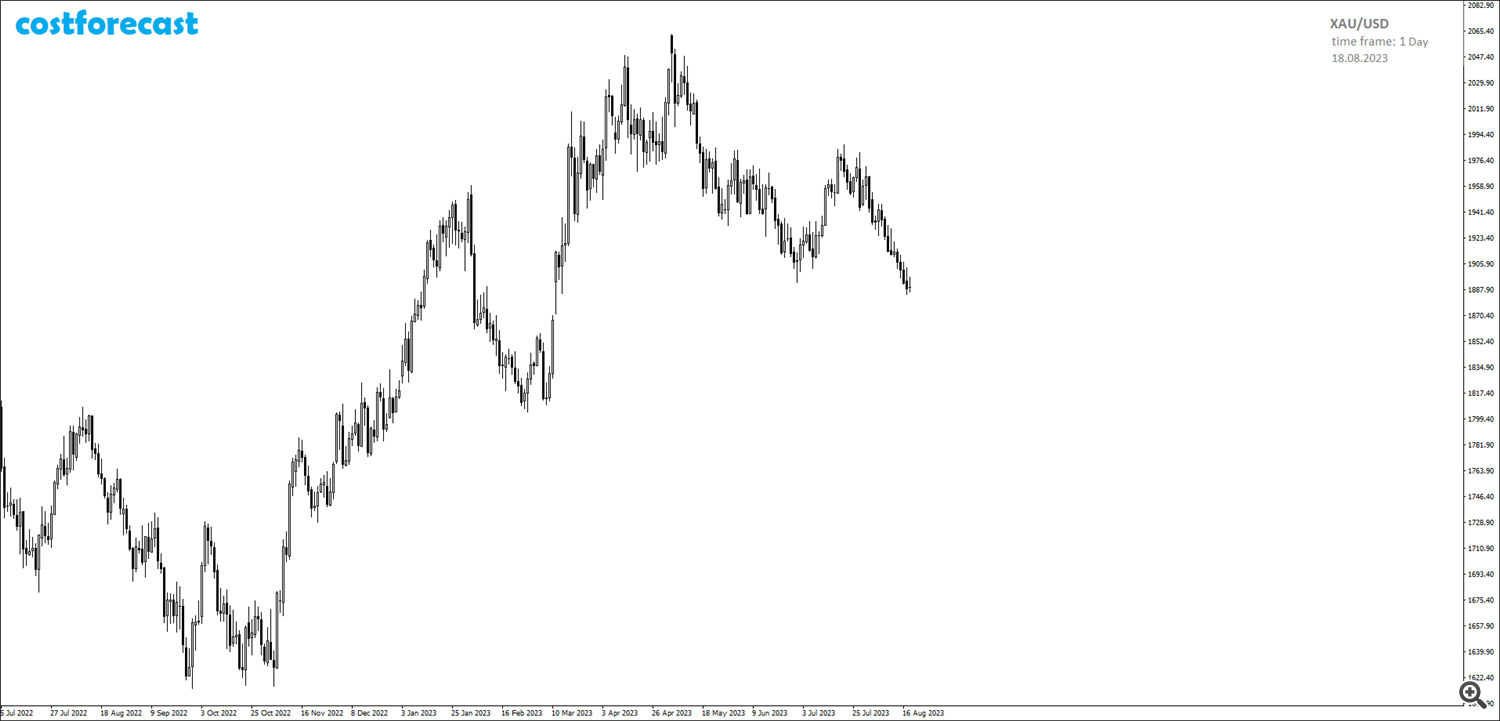
As of August 18, 2023, the chart of gold price dynamics, built with a daily time frame, looks like this (Fig. 5).
On the chart of gold price dynamics with a daily time frame, taking into account the global fractal structure, two alternative fractal structures can be identified (two scenarios for the possible development of price dynamics), both having the same 50% probability of implementation as of 08/18/2023.
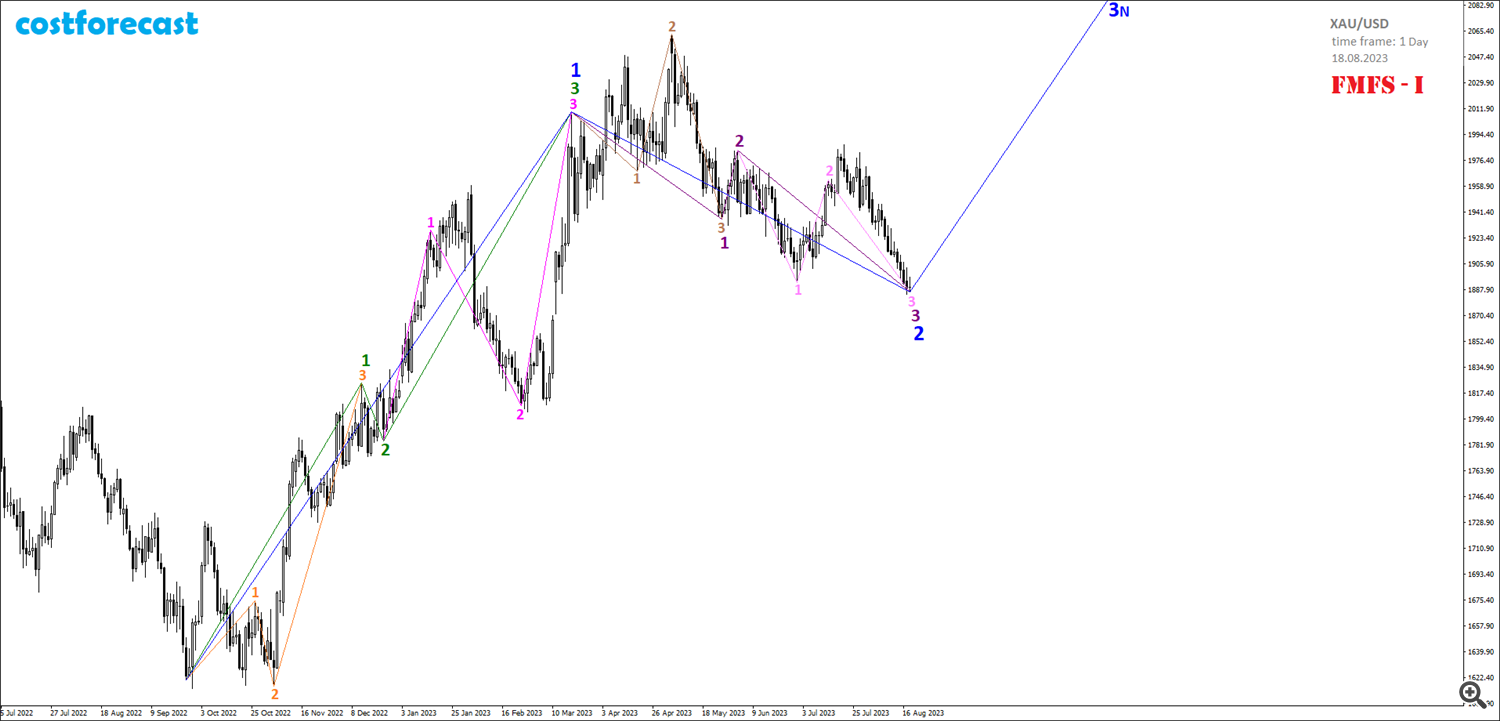
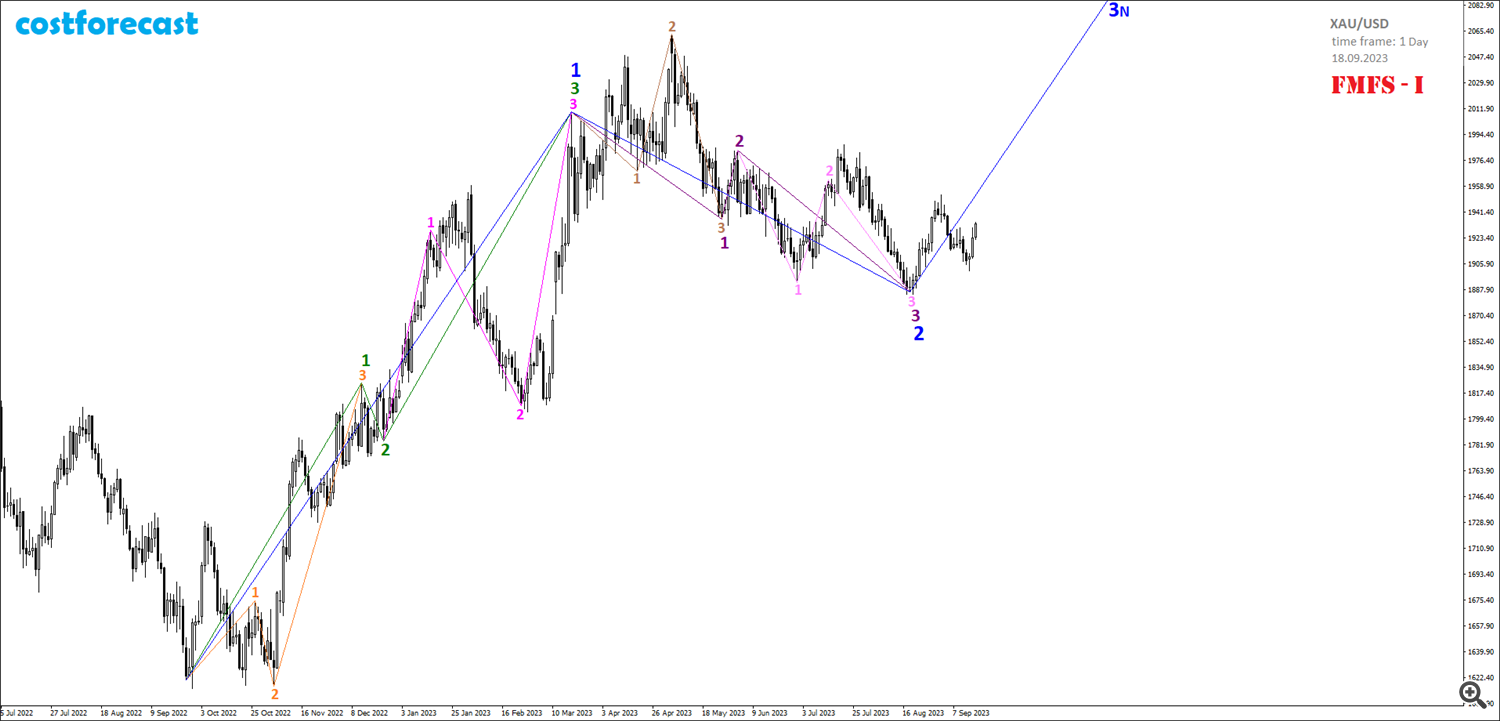
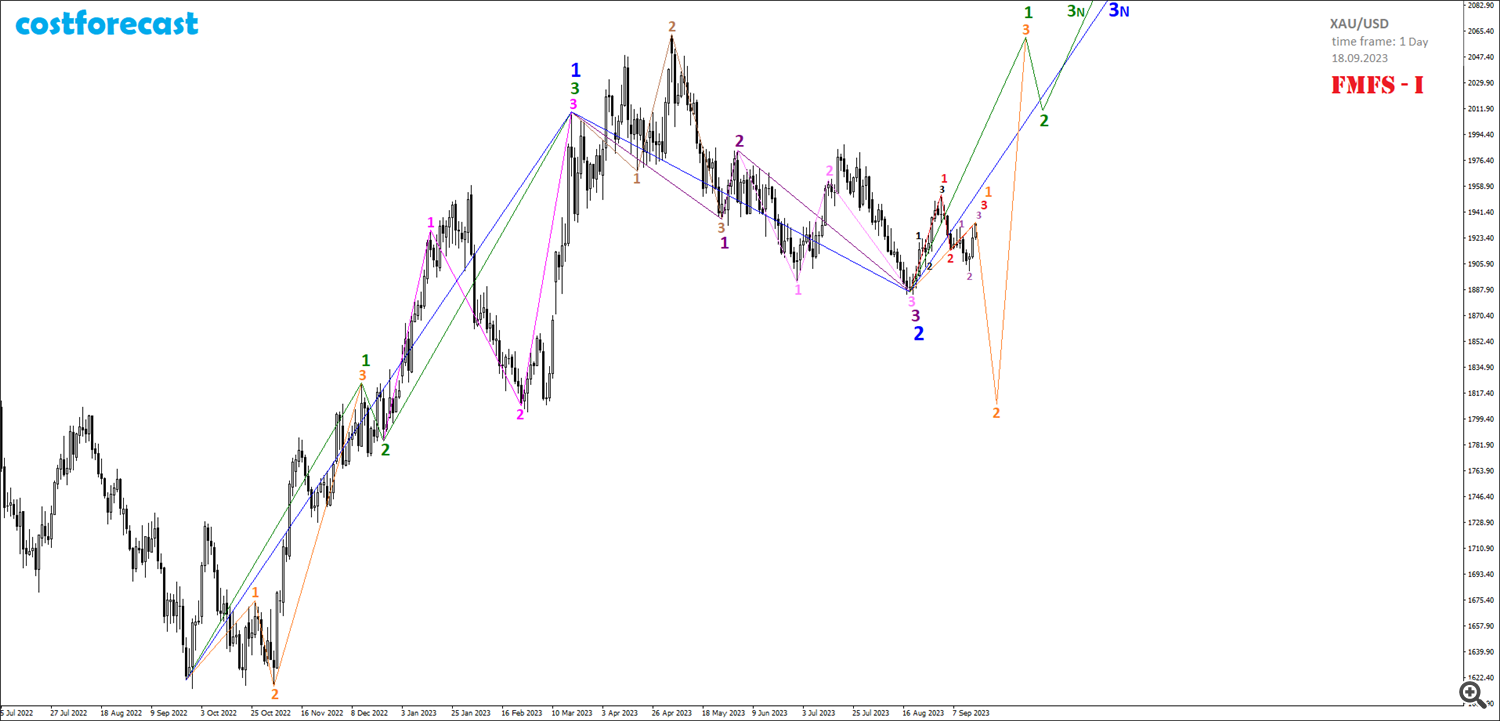
1-ый сценарий FMFS-I развития динамики котировок золота (Рис. 6) предполагает, что в точке с координатами (26.09.2022; 1621,01) начал своё формирование фрактал, который обозначен зелёным цветом, а в точке с координатами (20.03.2023; 2009,68) этот фрактал завершился.
The first FMFS-I scenario for the development of gold price dynamics (Fig. 6) assumes that at the point with coordinates (09.26.2022; 1621.01), a fractal began its formation, which is indicated in green, and at the point with coordinates (20.03. 2023; 2009.68) this fractal has ended.
This green fractal was formed in the form of fractal F-No. 21 from the Niro Attractor Alphabet. Moreover, the 1st segment of the green fractal was formed in the form of fractal F-No. 13, with an order one lower, which is indicated in orange on the time interval (09.26.2022; 12.13.2022). The 2nd segment of the green fractal was formed in the form of fractal F-No. 24 on the time interval (12/13/2022; 12/22/2022). The 3rd segment of the green fractal was formed in the form of fractal F-№22, which is indicated in purple on the time interval (12/21/2022; 03/20/2023).
Thus, we can assume that in the time interval (09/26/2022; 03/20/2023) the formation of the 1st segment of the fractal, indicated in blue in the cost range (1621.01; 2009.68), occurred. If this is so, then the 2nd segment of this blue fractal was formed on the time interval (03/20/2023; 08/18/2023) in the form of a fractal with an order less than one, which is indicated on the chart by fractal F-No. 21 from the Alphabet of Attractors Niro dark-purple color.
The first segment of this dark purple fractal was formed on the time interval (03/20/2023; 05/26/2023) in the form of fractal F-№14, which has an order of one less and is indicated in light brown. The 2nd segment of the dark purple fractal formed as a mono segment on the time interval (05/26/2023; 06/02/2023). Well, the 3rd segment of this dark purple fractal F-No. 21 was formed on the time interval (06/02/2023; 08/18/2023) in the form of fractal F-No. 23, which is indicated in pink on the chart.
Taking into account these assumptions, within the framework of the 1st FMFS-I scenario, the upcoming dynamics of gold quotations will have to occur in an upward trend within the framework of the formation of the 3rd segment of the fractal, which is indicated in blue on the chart.
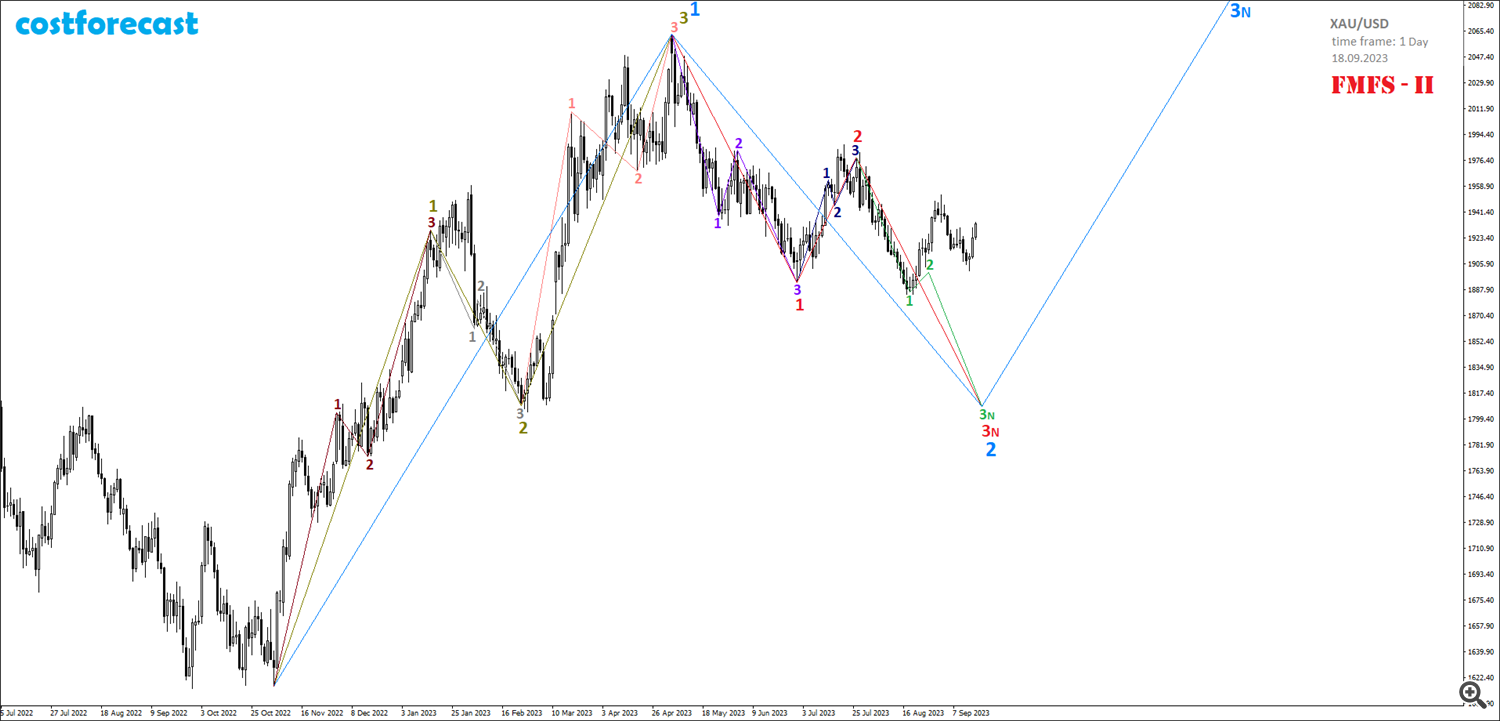
However, analysis of the fractal structure shows that there is another scenario (Fig. 7) for the possible dynamics of gold prices after 08/18/2023, which cannot be ignored when developing trading strategies and tactics due to the fact that it has the same probability of implementation as 1st scenario.
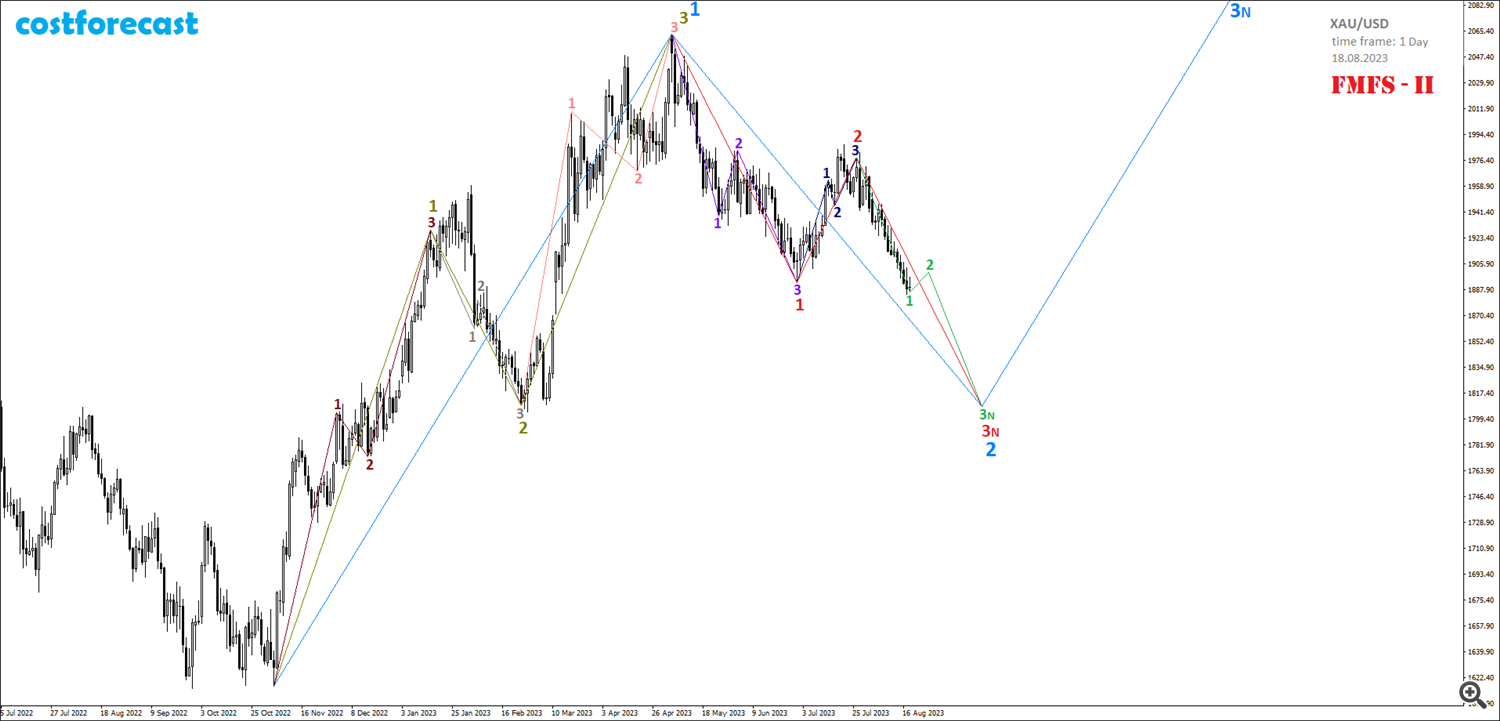
According to the 2nd FMFS-II scenario, the downward dynamics of gold quotes, which began at the point with coordinates (05/04/2023; 2062.80), has not yet been completed, as it is in the process of forming a fractal, indicated on the chart by fractal F-№22 in red, with a predicted completion in the vicinity of the point with coordinates (09.20.2023; 1808.23).
As of 08/18/2023, within the framework of the FMFS-II scenario (Fig. 7), we can say that the 1st segment of the red fractal F-№22 was formed in the time interval (05/04/2023; 06/29/2023) in the form of fractal F-№ 22, which is indicated in purple. The 2nd segment of the red fractal is designated by fractal F-№34 on the time interval (06/29/2023; 07/27/2023). Taking into account these assumptions, the current dynamics of gold quotations is at the stage of formation of the 3rd segment of the red fractal, which is indicated on the chart by the green fractal F-No. 21, and the 1st segment of the green fractal has already formed on the time interval (07.27.2023; 08.18. 2023), and the 2nd segment will only begin its formation.
The reason to believe that in the fractal structure on the time interval (05/04/2023; 09/20/2023) a fractal can be formed, which is indicated in red, is the assumption that on the time interval (11/03/2022; 05/04/2023) the fractal F-№ was formed 22, indicated in the graph in olive color.
In this case, the 1st segment of the olive-colored fractal was formed in the form of fractal F-No. 21 on the time interval (11/03/2022; 01/16/2023) and is indicated in brown on the chart. The 2nd segment of the olive fractal has the form of fractal F-№21 and is indicated in gray on the time interval (01/16/2023; 02/24/2023). Well, on the time interval (02/24/2023; 05/04/2023), fractal F-No. 32 was formed, which is indicated in pale red and which is the 3rd segment of this olive fractal.
Thus, having, as of 08/18/2023, two possible models for the development of gold price dynamics, we can assume that a continued decline in quotations is unlikely and that after 08/18/2023, either an explosive growth in quotations will follow within the framework of the implementation of the 1st scenario FMFS-I through the beginning of the formation the 3rd segment of the blue fractal, or a sideways trend will follow within the framework of the implementation of the 2nd FMFS-II scenario through the formation of the 2nd segment of the green fractal with a subsequent decrease in quotes and the formation of the 3rd segment of this green fractal.
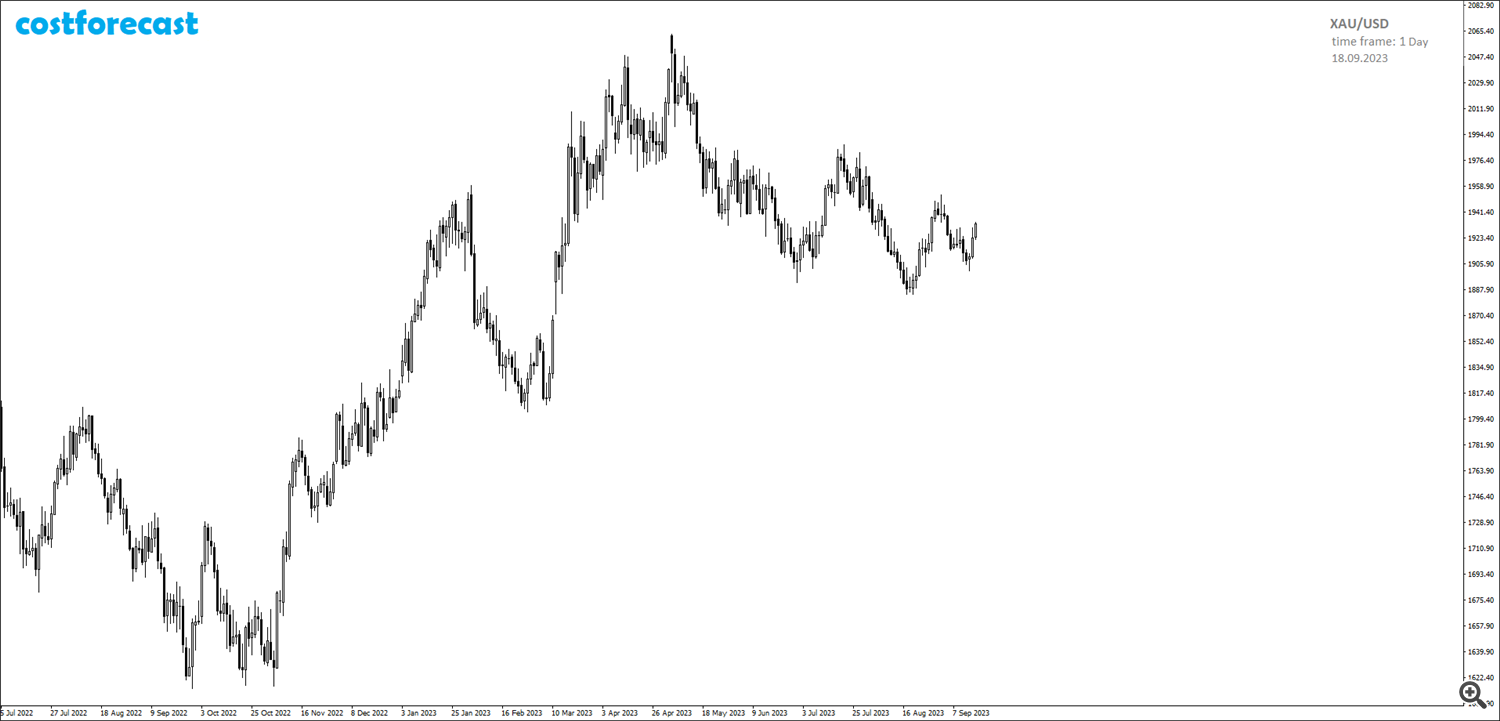
As of September 18, 2023, the chart of gold price dynamics, built with a daily time frame, looks like this (Fig. 8).
Let's plot the fractal structures of the first and second models, built on 08/18/2023, on the graph dated September 18, 2023.
The growth in gold prices, which began after August 18, 2023, was not as explosive as expected in the 1st FMFS-I scenario within the framework of the formation of the 3rd segment of the blue fractal (Fig. 9). But despite this, this scenario remains working and we should expect a continuation of the upward trend as part of the continuation of the construction of the 3rd segment of the blue fractal in the fractal structure.
The 2nd scenario FMFS-II (Fig. 10), in contrast to the 1st, on September 18, 2023, ceased to be considered as possible for implementation due to the fact that the fractal structure formed during the time interval (08/18/2023; 09/18/2023) did not suggests the possibility of forming a fractal, indicated in green on the chart, thereby putting an end to the formation of a red fractal, of which it is the 3rd segment.
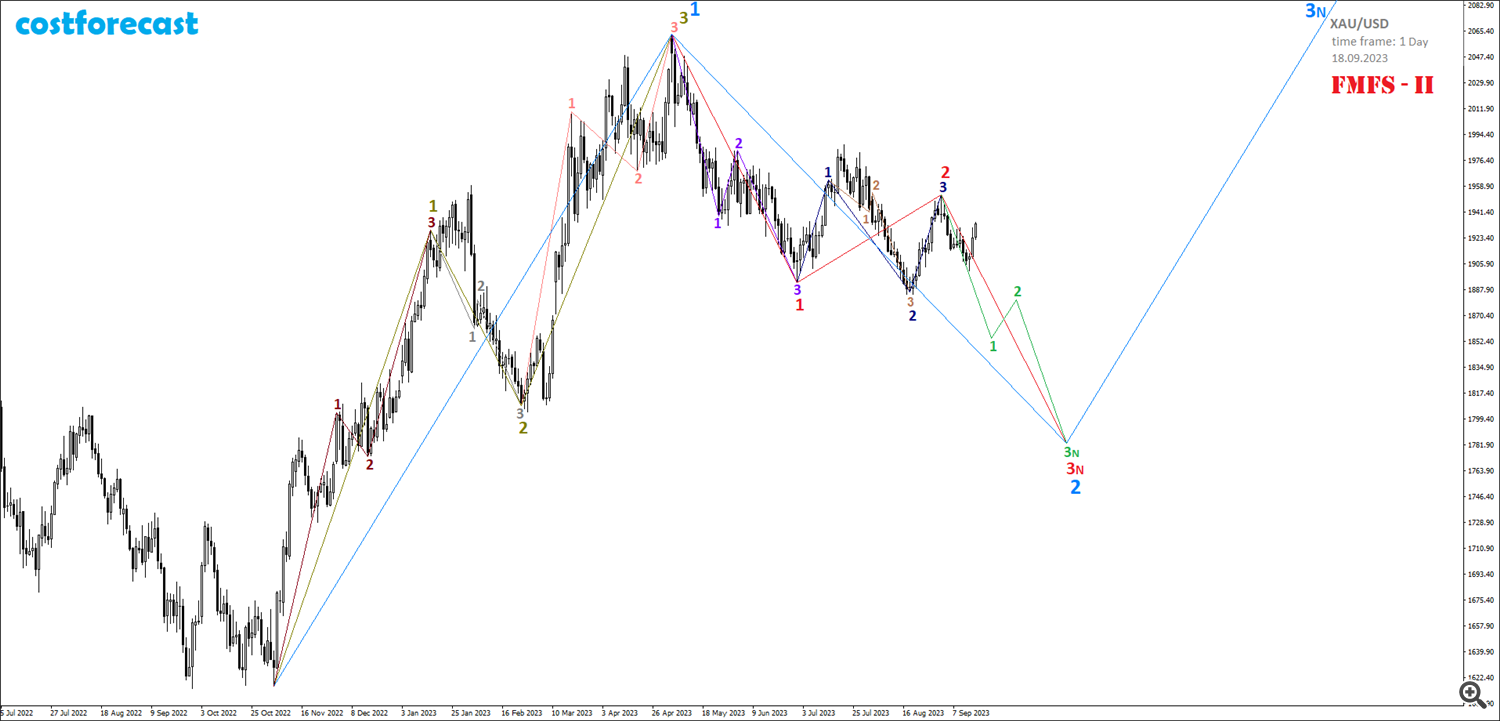
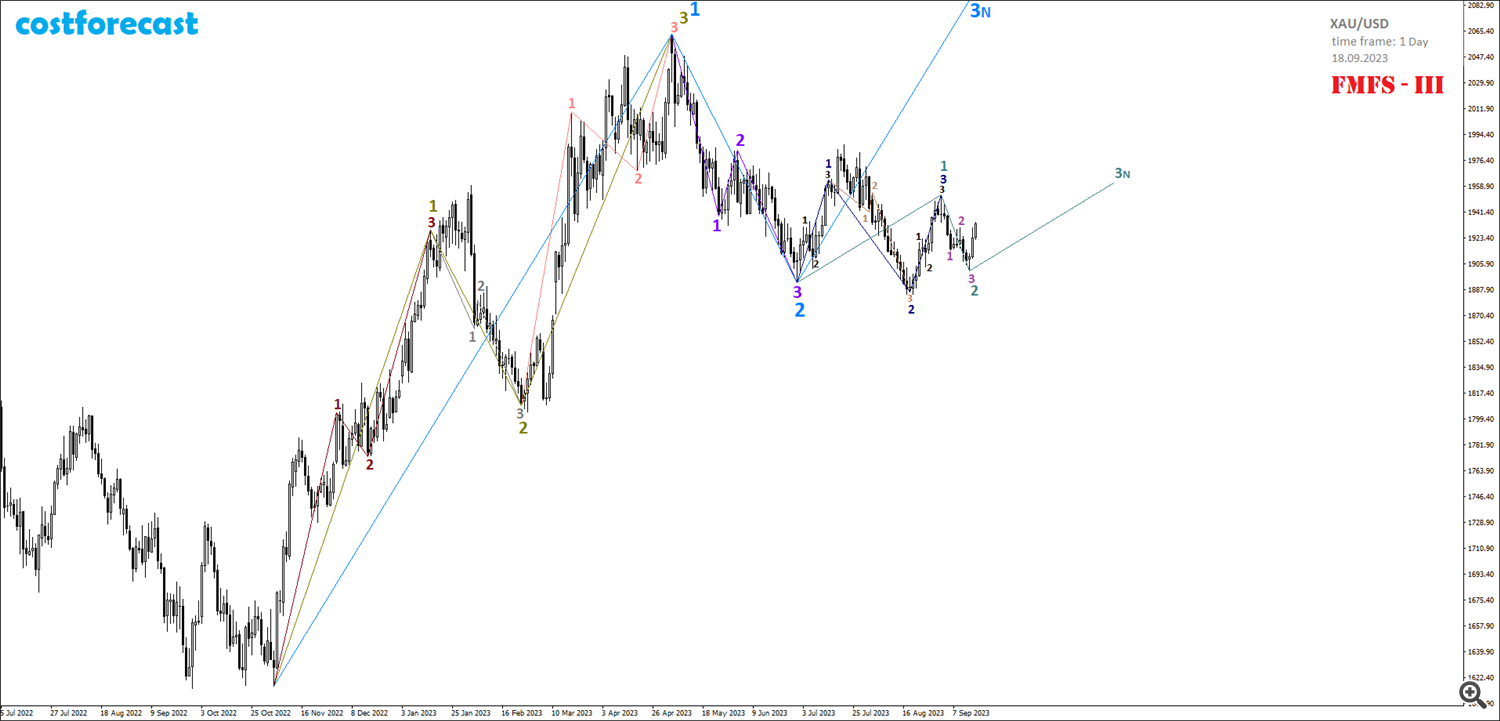
However, the existing fractal structure makes it possible not to completely abandon the 2nd model of possible dynamics, but to revise it by breaking it down into two more models with extremely low probabilities of implementation, combining fractals in the 2nd scenario in two ways (Fig. 11 and Fig. 12). Thus, as of 09/18/2023, three models of possible dynamics of gold prices can be compiled: 1st scenario – the FMFS-I model, compiled on 08/18/2023 and having the highest probability of implementation (Fig. 9), 2nd scenario – model FMFS-II (Fig. 11) and the 3rd scenario - the FMFS-III model (Fig. 12), compiled on September 18, 2023 and having a minimum probability of implementation.
As of September 18, 2023, analysis of fractal structures of lower orders on charts of gold price dynamics built with hourly time frames gives reason to believe that the model of future gold price dynamics according to the 1st FMFS-I scenario has the highest probability of implementation (Fig. 13).
As of 08/18/2023, the completion of the 2nd segment of the blue fractal on the time interval (03/20/2023; 08/18/2023) was expected to be followed by an explosive increase in gold prices, within which the cost of a troy ounce would have to exceed $2,100. However, no explosive growth in quotations occurred and on the time interval (08/18/2023; 09/18/2023) a fractal structure was formed, within which the price of gold remained virtually unchanged and remained in a narrow range at $1,900 per ounce.
Despite such sluggish growth in quotes, the 1st FMFS-I scenario still remains a priority for consideration. If so, then explosive growth in quotes should still be expected.
Analysis of small fractal structures shows that in the time interval (08/18/2023; 09/18/2023) fractal F-No. 34 from the Alphabet of Attractors Niro was formed, which is indicated in red on the graph. If this assumption is correct, then an explosive growth in quotes is possible only in one case, if this red fractal is the 1st segment of a larger order fractal F-No. 35, which is indicated in orange. In this case, we should expect a sharp decline in gold quotes as part of the formation of the 2nd segment of the orange fractal, followed by a sharp increase in quotes as part of the formation of the 3rd segment of the orange fractal towards the level of $2,100 per ounce.
The formed orange fractal will be the 1st segment of a fractal of one higher order, which is indicated in green on the graph. After the completion of the orange fractal, gold quotations will have to decrease as part of the formation of the 2nd segment of the green fractal, after which the growth of quotations will continue at an even greater pace, updating historical highs as part of the formation of the 3rd segment of the green fractal.
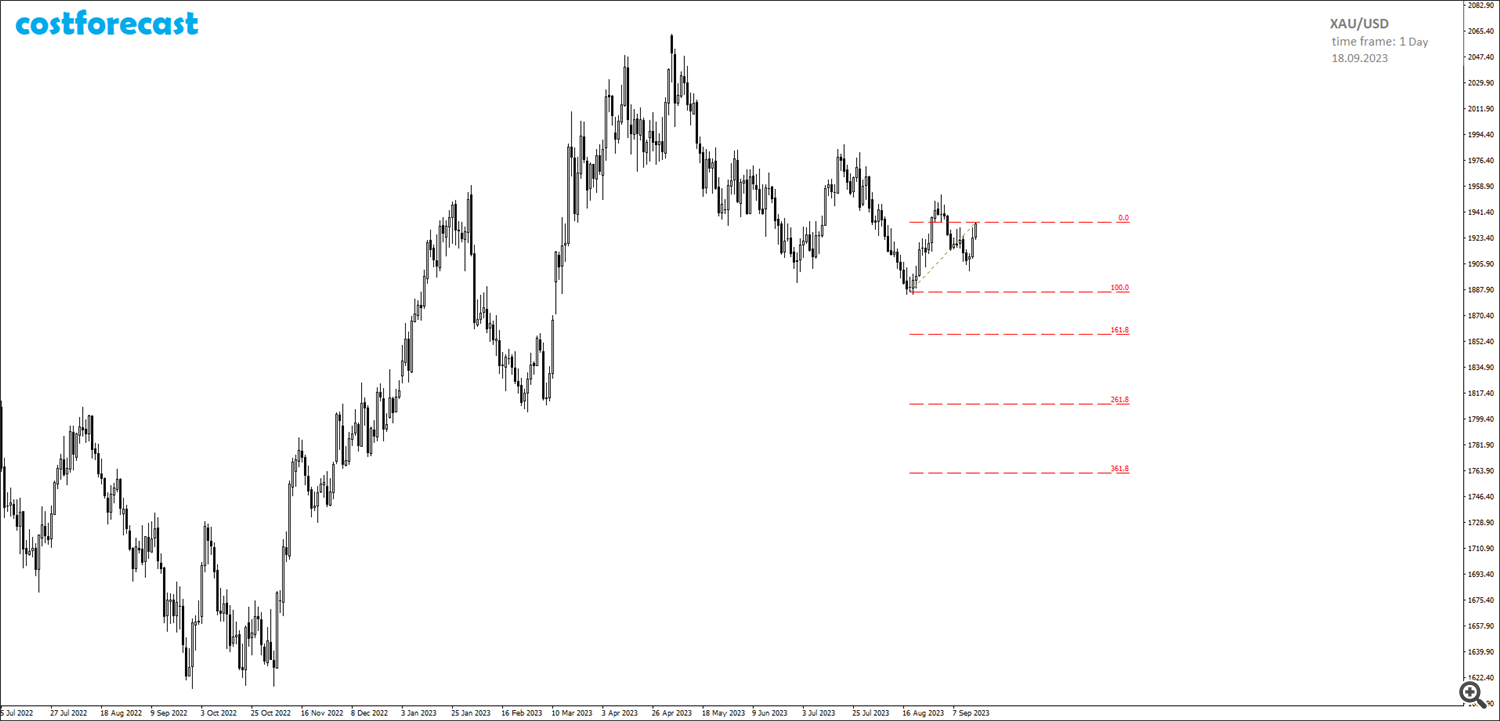
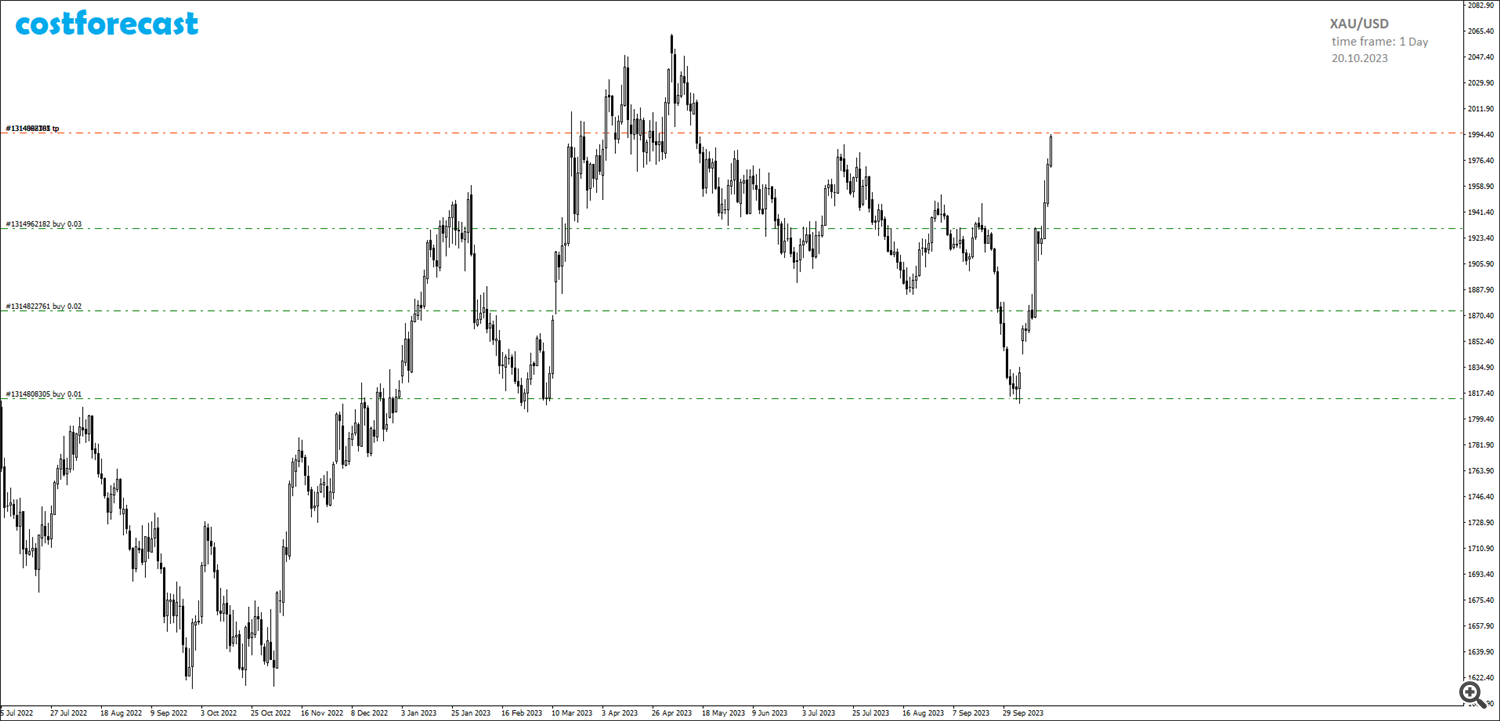
With a deposit equal to 3 USD, the most appropriate moment to buy gold will be the completion of the 2nd segment of the orange fractal at one of the Fibonacci grid levels (Fig. 14).
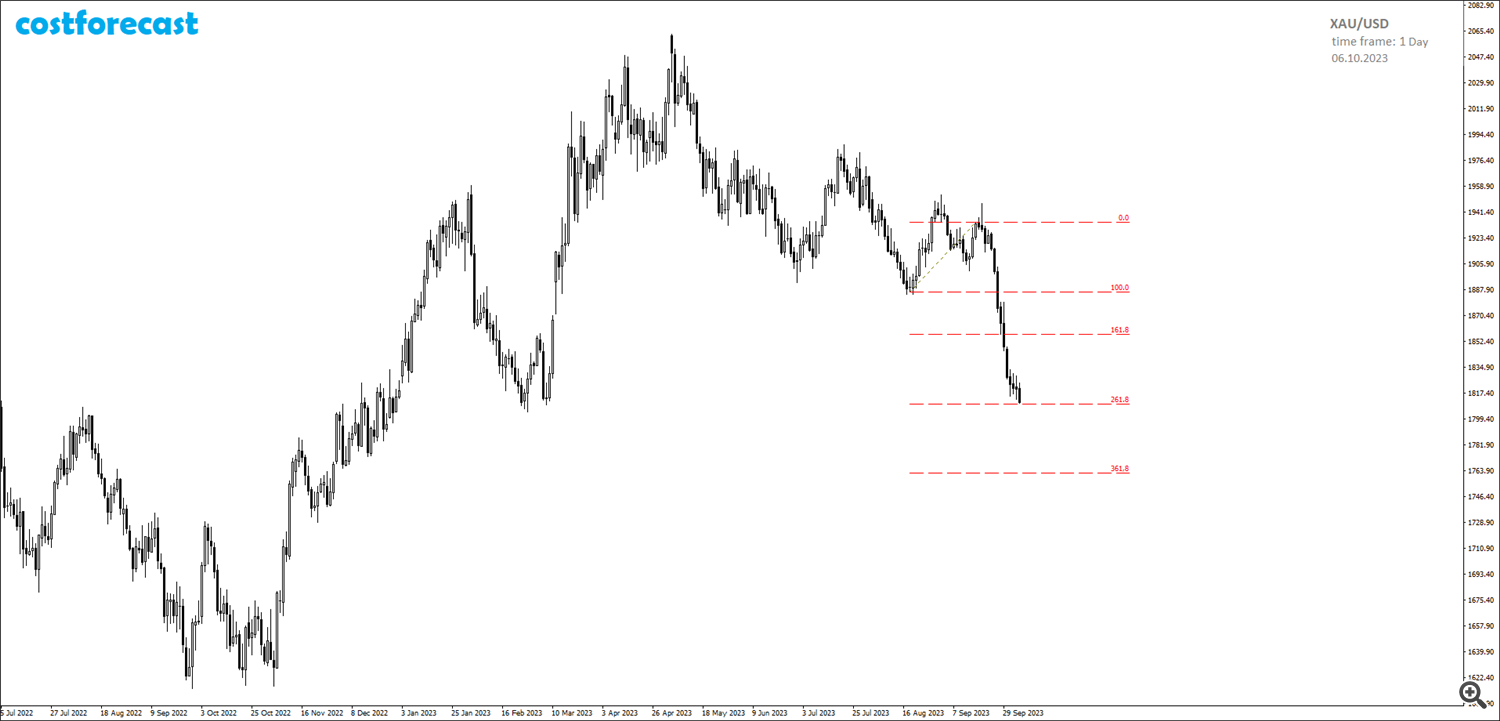
The length of the 1st segment of the orange fractal is 47.40 USD. The most likely length of the 2nd segment of the orange fractal in the event of a sharp drop in quotes will be a length equal to 2.618 of the length of the 1st segment, that is, equal to 124.09 USD. Thus, an acceptable quote for opening a long position in gold will be in the range from 1,812 to 1,815 USD per troy ounce (Fig. 15).
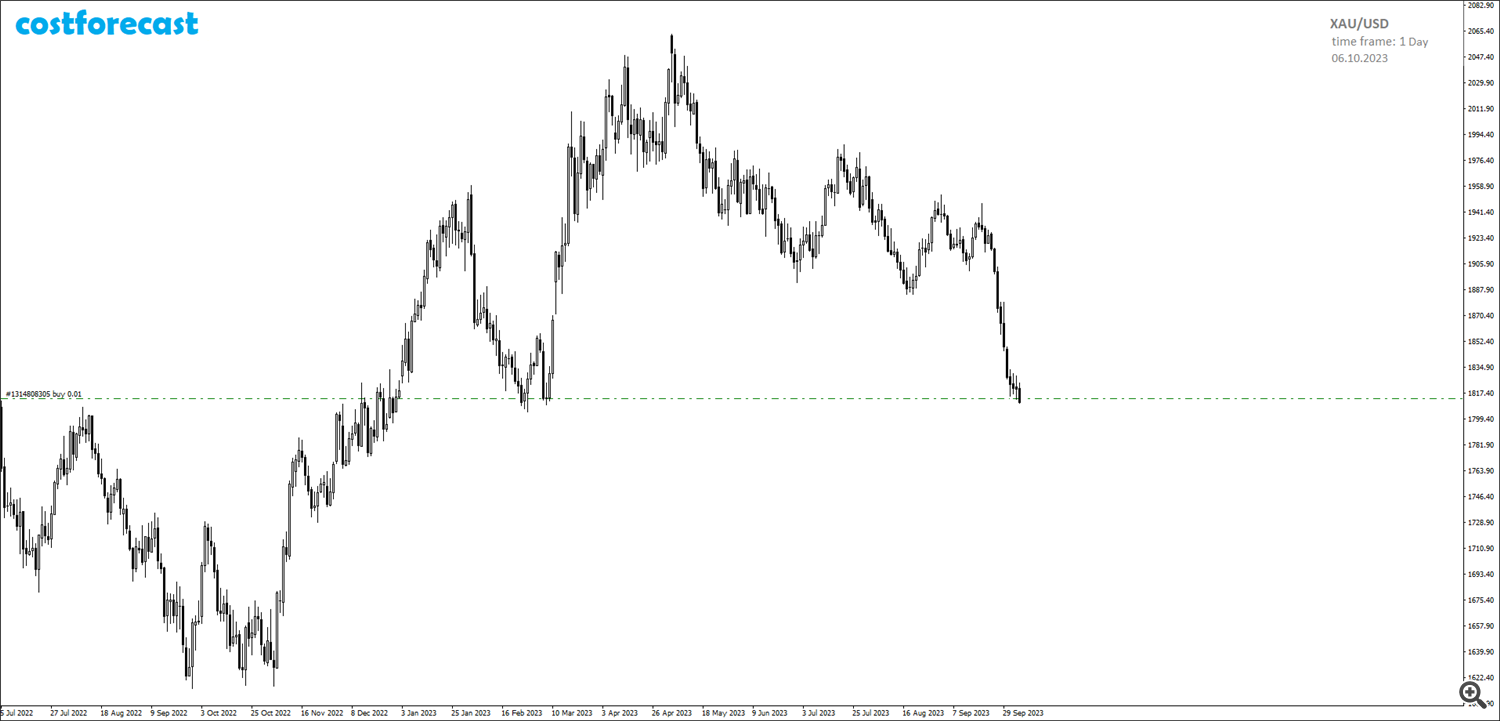
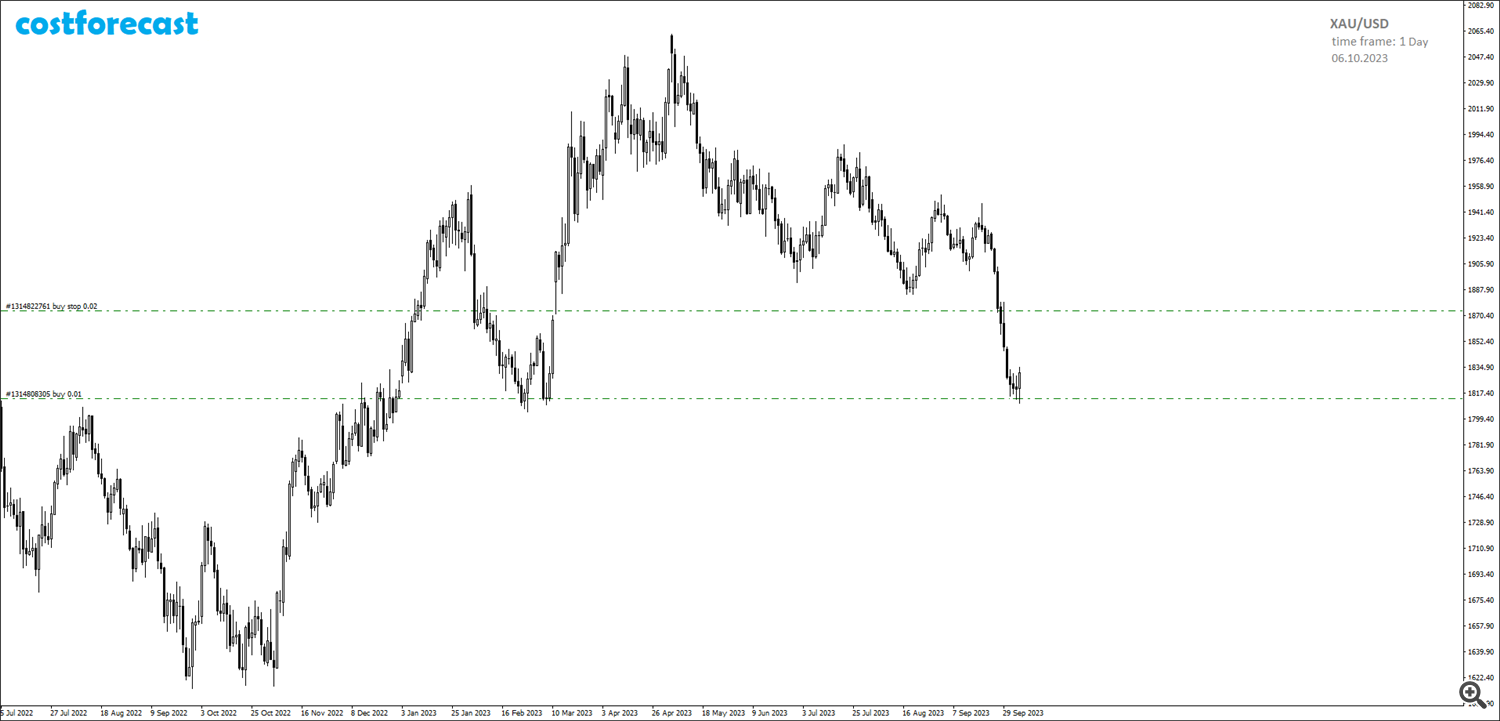
10/06/2023 after the completion of the 2nd segment of the orange fractal at the calculated point determined by analyzing the smallest fractal structures of charts with minute time frames, a long position in gold was opened with 0.01 lots at a price of $1,813.56 per troy ounce (Fig. 16).
The closing of the daily candle on 10/06/2023 above the market entry point gives reason to assume that the chosen model is correct for the future dynamics of gold prices according to the 1st FMFS-I scenario (Fig. 17). In anticipation of an explosive growth in gold prices, it was decided to add a pending buy stop order with a volume of 0.02 lots at $1,873.56 per ounce in addition to the open long position.
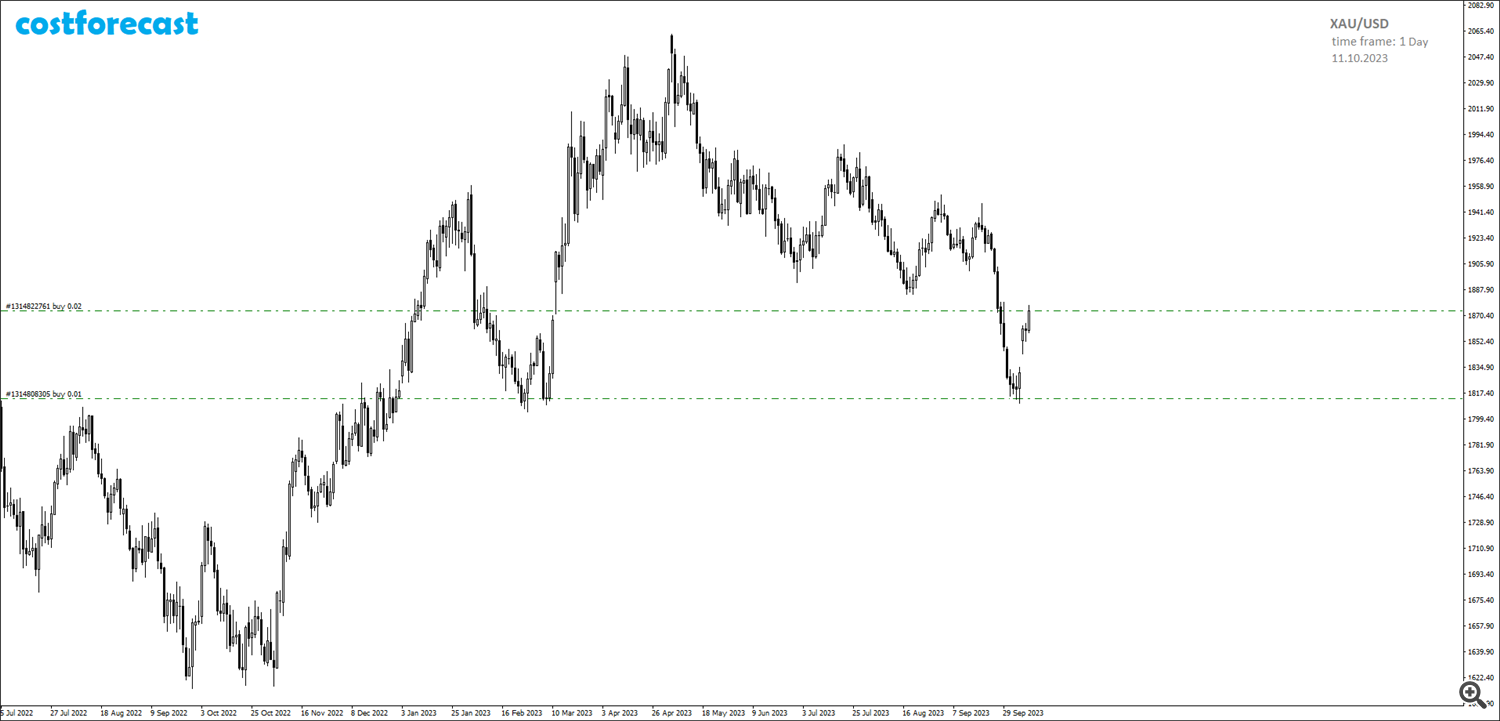
On 10/11/2023, the pending buy stop order placed on 10/06/2023 was triggered, and a second long position in gold was opened (Fig. 18).
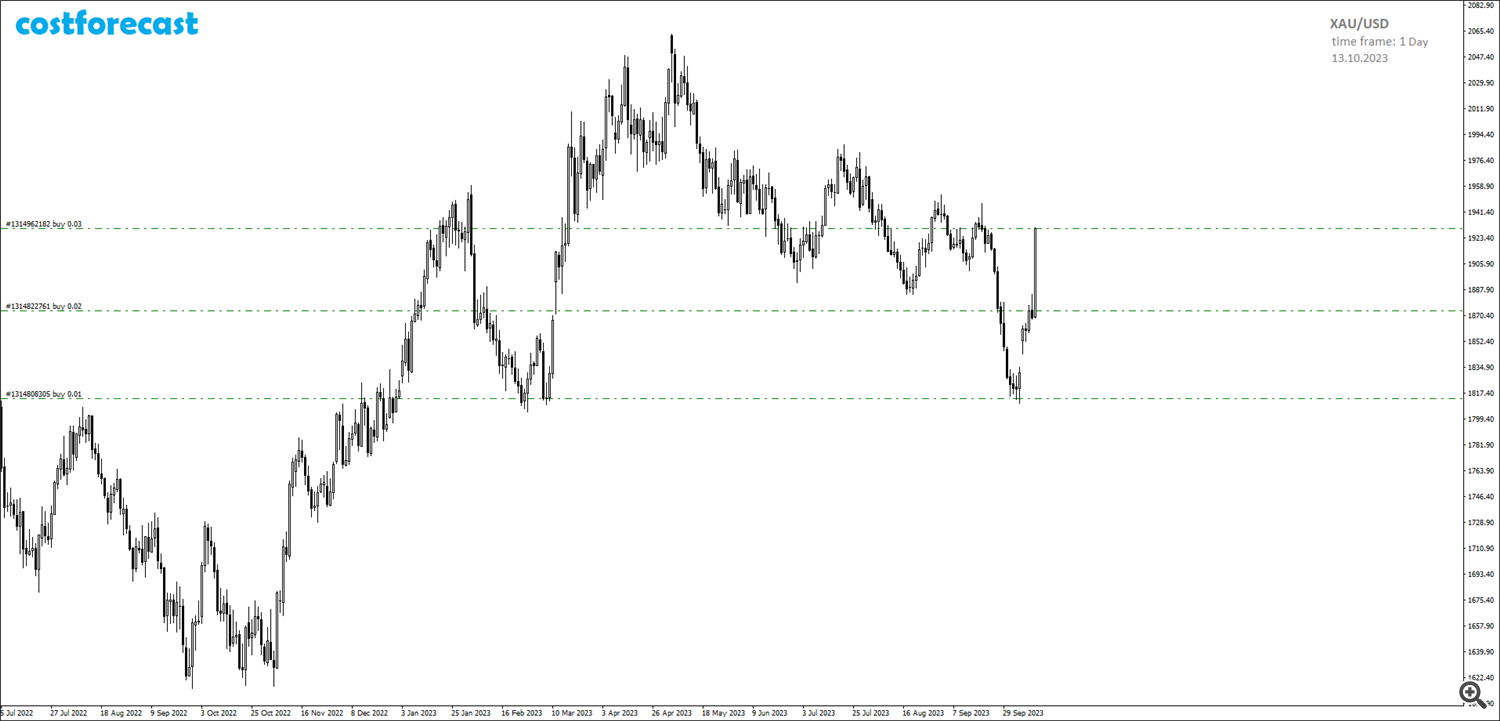
The growth of gold quotations that began on 10/06/2023 continued and on 10/13/2023 another long position with a volume of 0.03 lots was opened at $1,929.96 per ounce in the hope of continued growth in quotations as part of the formation of the 3rd segment of the orange fractal in in accordance with the 1st FMFS-I scenario (Fig. 19).
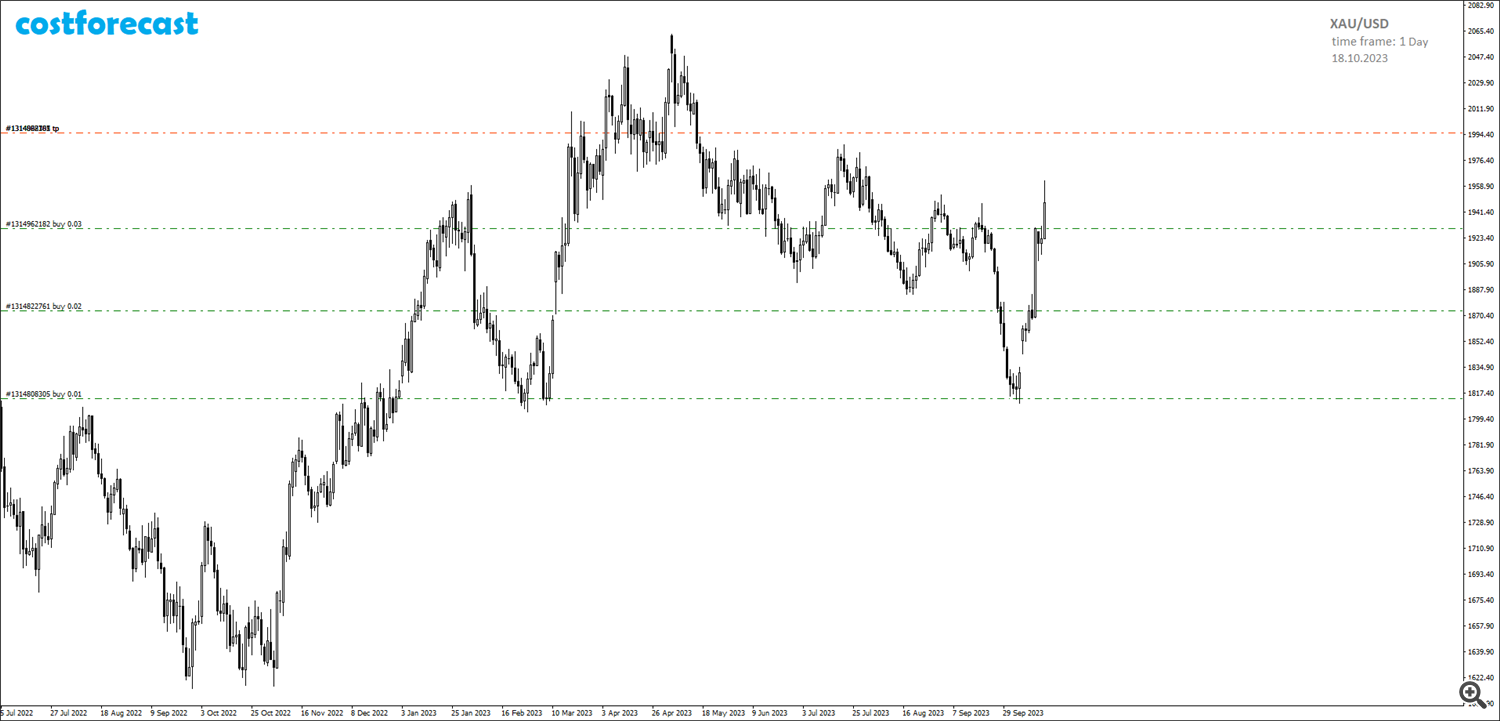
On 10/18/2023, for each open position, a take profit was set at $1,995.23 per troy ounce in order to fix the total profit for all three positions in the amount of at least 600.00 USD (Fig. 20).
On 10/20/2023, all three long gold positions were closed at take profit at $1,995.24 per ounce (Fig. 21).
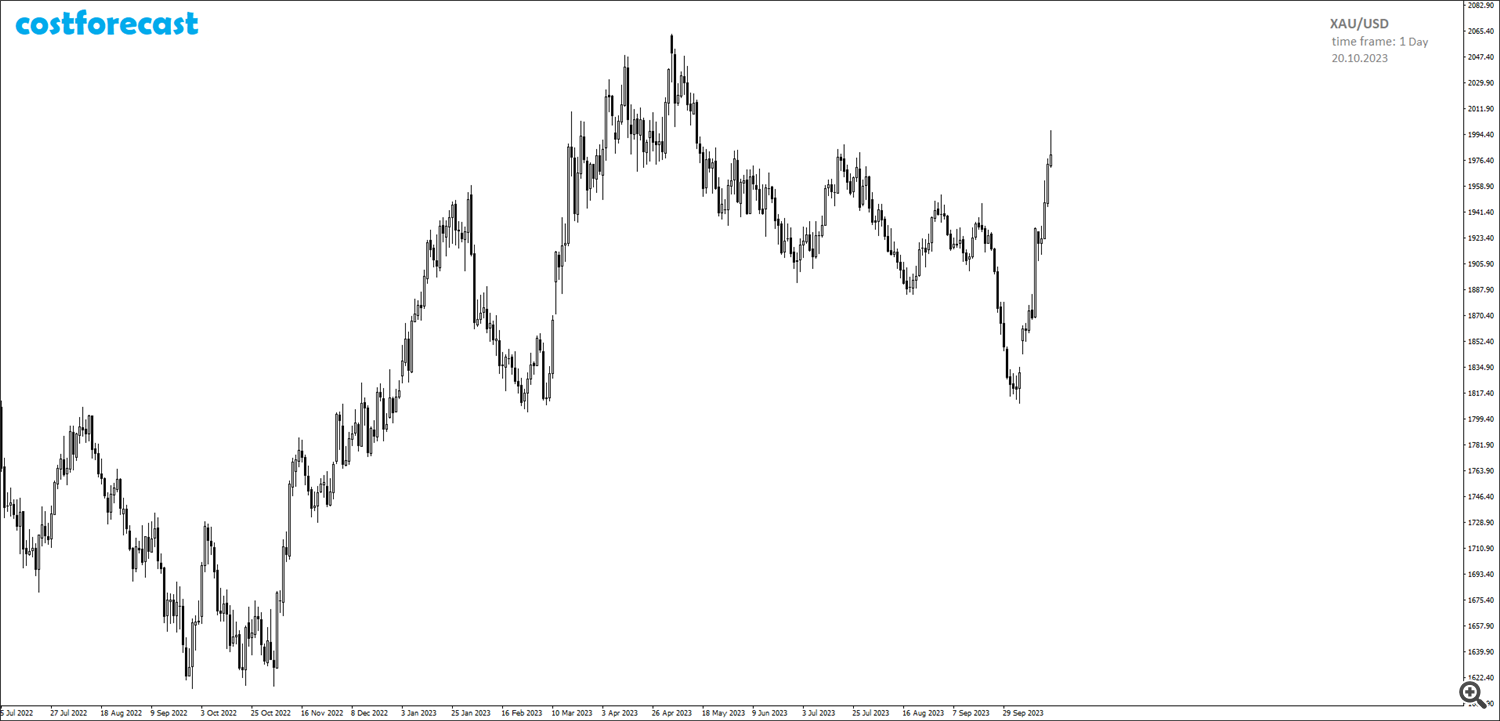
After the close of the trading day on October 20, 2023, the chart of gold price dynamics looks as follows (Fig. 22).
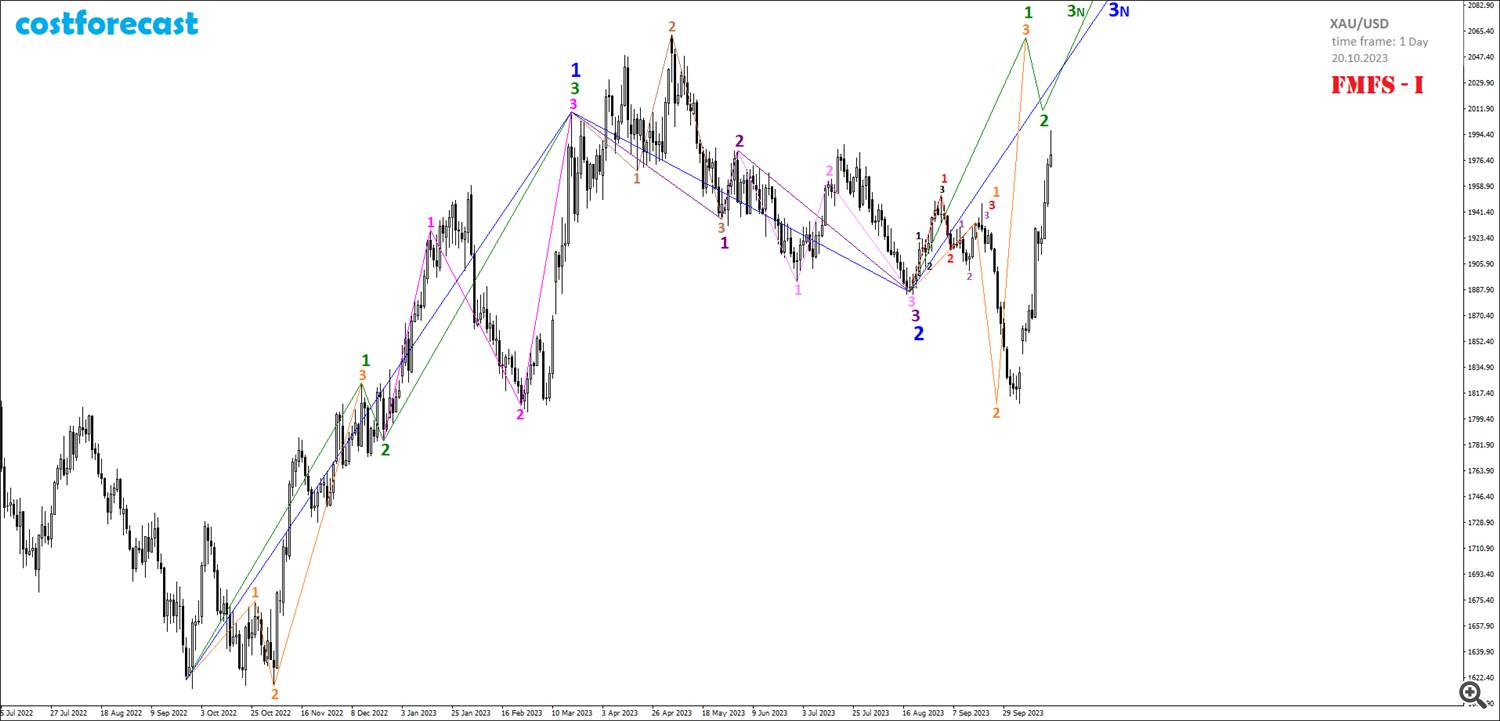
Let us plot the fractal structure of the 1st model, which was compiled on September 18, 2023, on the gold price dynamics chart that was formed on October 20, 2023 (Fig. 23).
It can be stated that the growth of gold prices began on 10/06/2023 after the completion of the 2nd segment of the orange fractal and continues as part of the formation of the 3rd segment of this orange fractal. High growth rates show that the 1st FMFS-I model of possible upcoming dynamics (Fig. 6), which was compiled on 08/18/2023, turned out to be correct.
The bet on the explosive growth of gold prices, despite the initial sluggish growth after 08/18/2023, was justified. Trading on the nano-account was completed after the deposit from 3 USD was increased to 600 USD, that is, 200 times (Fig. 24).

The profitability of trading in such a short period of time amounted to 20,000%, which in terms of annual profitability is 521,429% per annum.
As for the risks of such trading, in relative terms the risks are prohibitive, because the initial deposit of 3 USD could be completely lost in a couple of seconds. However, in absolute terms, the level of risk is the minimum imaginable, because it is equal to 3 USD, that is, we can say that the stop loss level for such trading is equal to the size of the deposit and is the minimum possible amount of 3 USD, which in terms of interest is 0.2% change in the price at which the position was opened.
Trading on this account is not completed after closing three long positions. After withdrawing funds from the account in three tranches in the amount of 541.38 USD, 61.70 USD remained on the deposit. Trading on this account will continue (Fig. 25). The only instrument used in trading on this account will be gold. Due to the fact that this account is not public, trading results will be published as the deposit grows simultaneously with current models of possible future dynamics of gold prices.
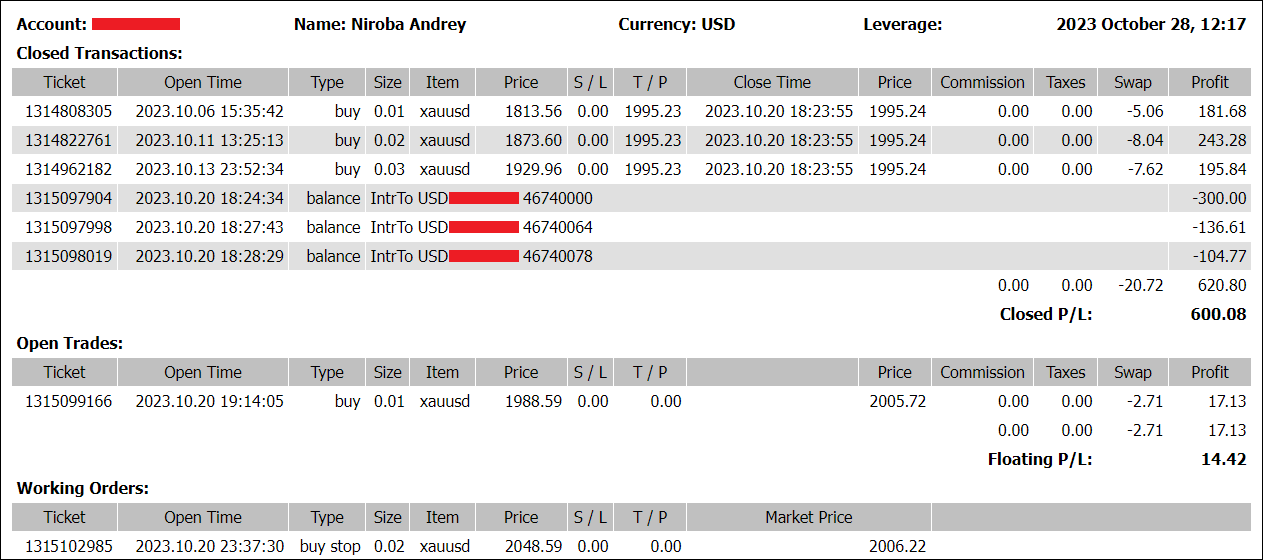
The first tranche of withdrawal of funds from the account in the amount of 300 USD was used to open a trading account called “Costforecast” (Fig. 26).

This account is a public account and you can monitor transactions performed on this trading account by clicking on the following link:
https://www.mql5.com/ru/signals/2102027
On a Costforecast account, only one instrument will be used for trading – XAU/USD.
The 2nd tranche of withdrawal of funds from the account in the amount of 136.61 USD (1,000 CNY converted at the rate of 7.32) was used to open a trading account called “Forexforecast” (Fig. 27).
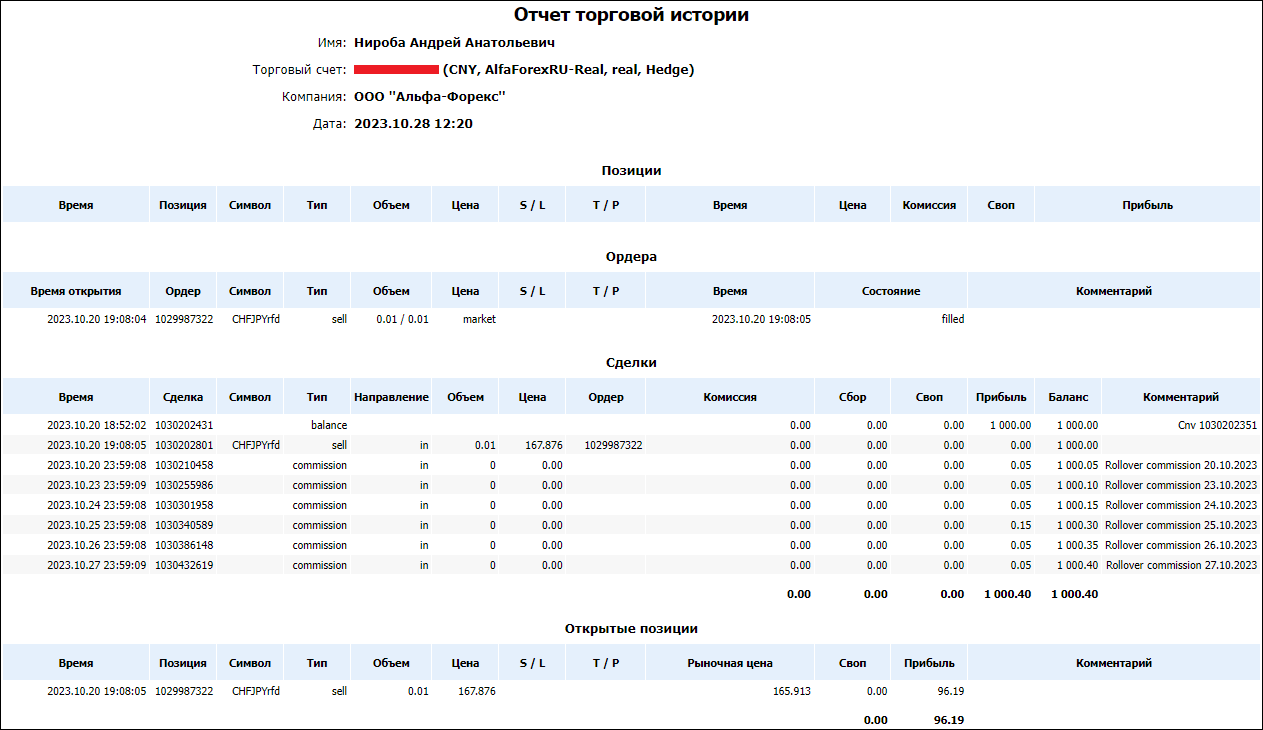
This account is a public account, so you can monitor trading on this account by clicking on the following link:
https://www.mql5.com/ru/signals/2102861
On the Forexforecast account, trading will be carried out in the following instruments: USD/EUR, USD/GBP, USD/AUD, USD/CHF, USD/CAD, USD/JPY, USD/RUB, USD/CNY, USD/NZD, USD/SEK, USD /NOK, USD/DKK, USD/SGD, USD/MXN, USD/ZAR, USD/TRY and cross rates of the specified currencies.
The 3rd tranche of withdrawal of funds from the account in the amount of 104.77 USD (10,000 RUB converted at the rate of 95.45) was used to open a trading account called “Quotesforecast” (Fig. 28).
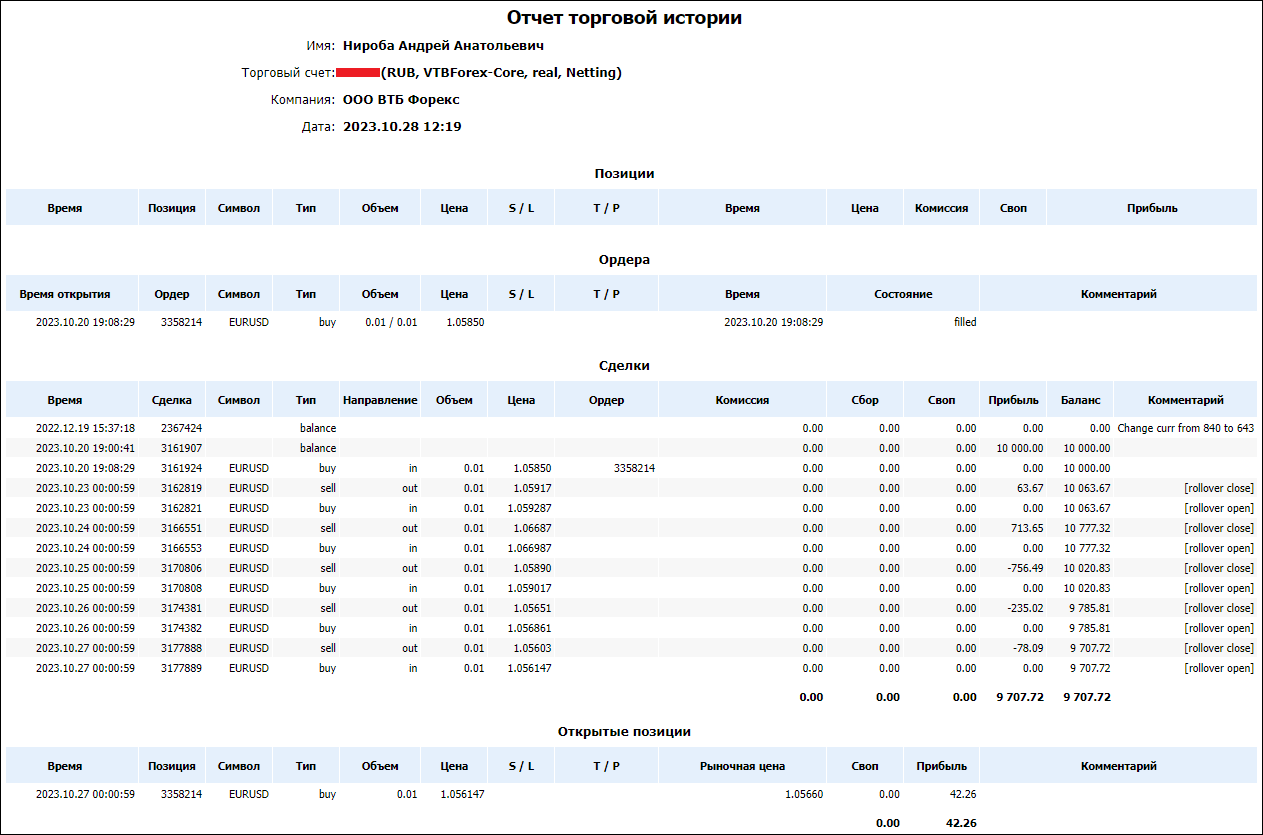
This account, like the previous two, is a public account, and you can monitor trading on it by clicking on the link:
https://www.mql5.com/ru/signals/2102923
The following instruments will be traded on the Quotesforecast account: EUR/USD, EUR/GBP, EUR/AUD, EUR/CHF, EUR/CAD, EUR/JPY, EUR/RUB, EUR/NZD.
The summary report for all four accounts looks like this (Fig. 29).
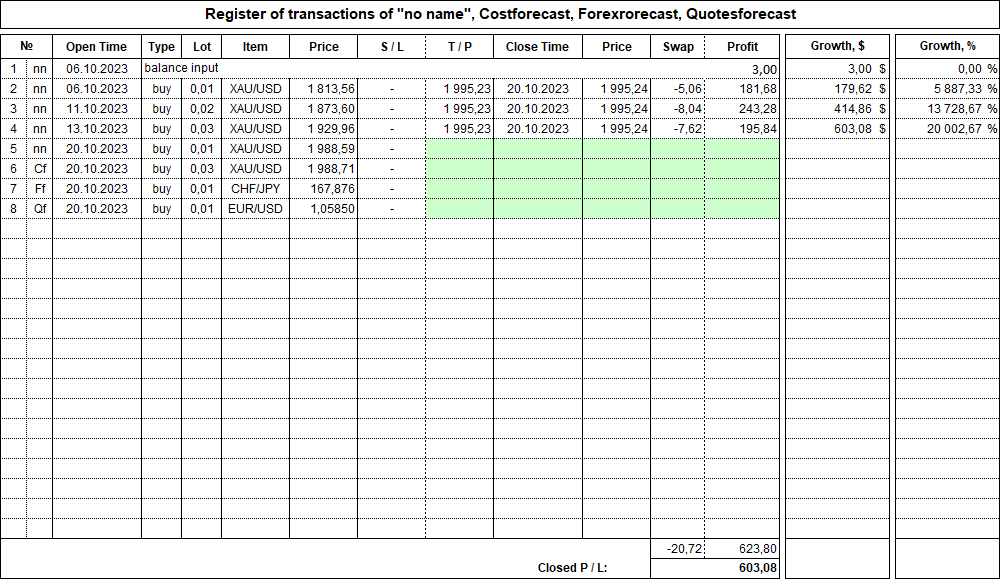
As for the already opened first three positions on three public accounts Costforecast, Forexforecast and Quotesforecast, on the Costforecast account on October 20, 2023, a long position with a volume of 0.03 lot was opened on the XAU/USD instrument at a quote of 1988.71 in the direction of the implementation of the 1st FMFS model -I of the future dynamics of gold prices, which was discussed above (Fig. 9).
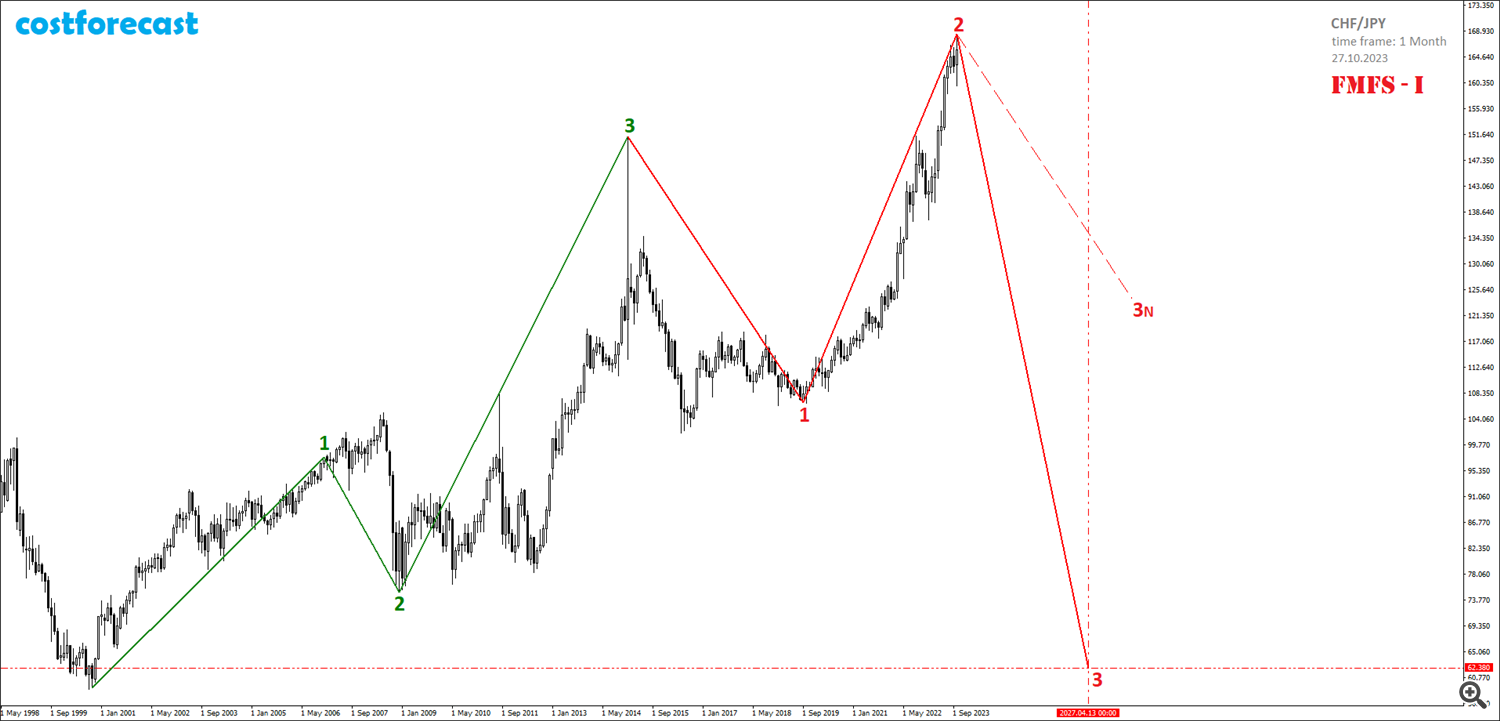
On the Forexforecast account, on October 20, 2023, a short position with a volume of 0.01 lot was opened for the CHF/JPY instrument at a quote of 167.876.
The decision to open a short position was made based on an analysis of the global fractal structure of the chart of the dynamics of quotes of the CHF/JPY currency pair, built with a time frame of 1 year (Fig. 30).
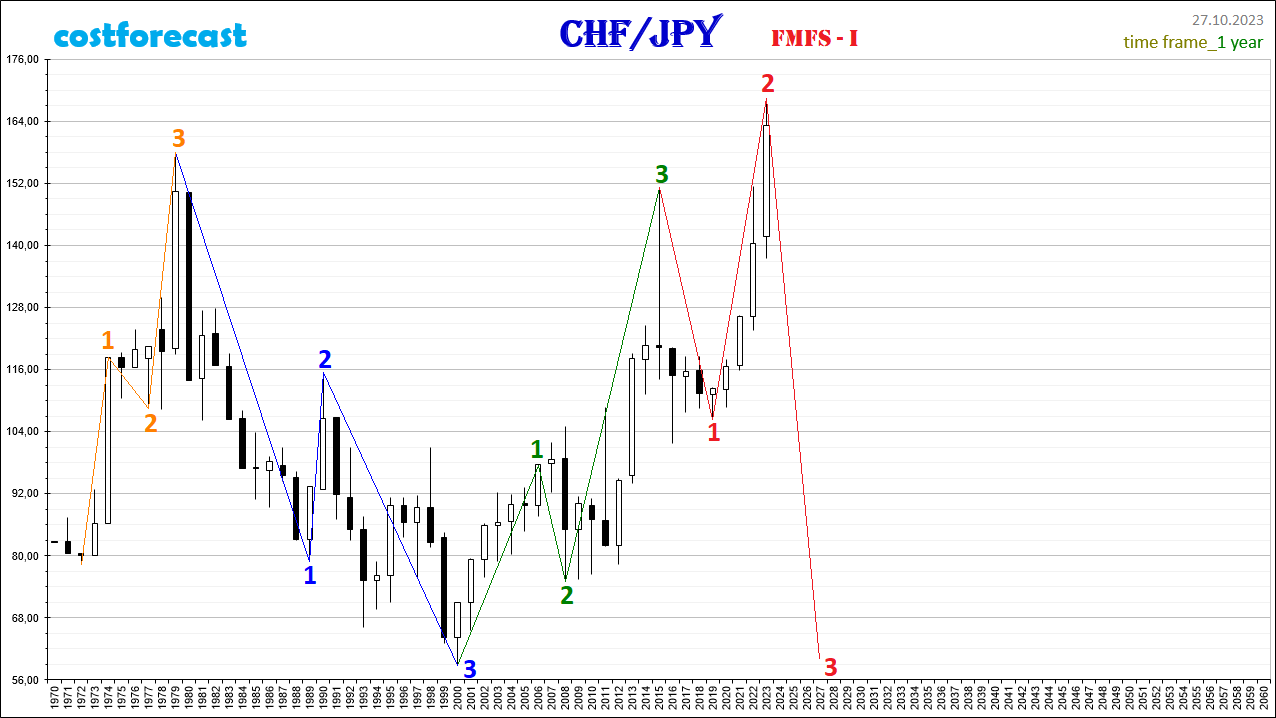
As of October 27, 2023, three already formed fractals can be distinguished in the global fractal structure of the CHF/JPY chart. The first fractal is indicated by fractal F-№21 from the Alphabet of Attractors Niro in orange on the time interval (1972; 1979). The second fractal is indicated by fractal F-№32 in blue on the time interval (1979;2000). The third fractal is indicated by fractal F-№12 in green on the time interval (2000; 2015).
Thus, as of October 27, 2023, the most likely model for the future dynamics of quotes of the CHF/JPY currency pair is the model that assumes the formation of fractal F-No. 14 in the fractal structure of the chart, indicated in red on the chart (Fig. 31).
At the moment, we can assume the completion of the 1st segment of the red fractal on the time interval (01.2015; 09.2019), the 2nd segment of the red fractal on the time interval (09.2019; 10.2023) and the possible beginning of the formation of the 3rd segment, the completion of which may take place in the vicinity of the point with coordinates (04/13/2027; 62.38). In this case, a long-term bearish trend for several years should be expected for the CHF/JPY currency pair.
On the Quotesforecast account, on October 20, 2023, a long position with a volume of 0.01 lot was opened on the EUR/USD instrument at a quote of 1.0585.
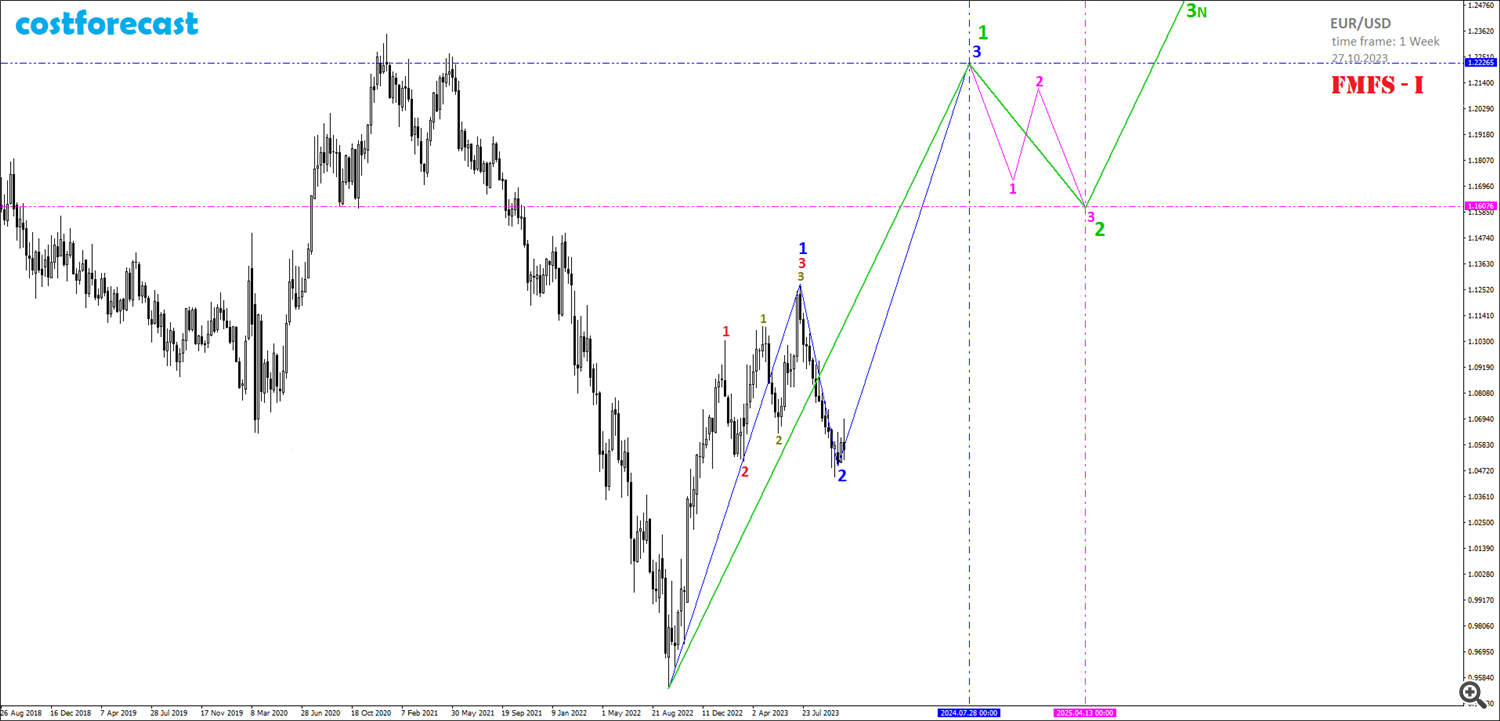
The decision to open a long position was made based on an analysis of the global fractal structure of the dynamics chart of the EUR/USD currency pair, built with a time frame of 4 months (Fig. 32).
At this point, we can assume that at the point with coordinates (1/3.2008; 1.6019), a fractal began to form in the fractal structure, indicated in blue on the graph.
The 1st segment of the blue fractal was formed in the form of fractal F-No. 22 from the Alphabet of Attractors Niro, indicated on the chart in red on the time interval (1/3.2008; 3/3.2016).
Taking into account this assumption, we can say that at the point with coordinates (3/3.2016; 1.0352), the 2nd segment of this blue fractal began to form and the current dynamics of quotes of the EUR/USD currency pair is in the stage of formation of the 3rd segment of the orange fractal, representing the 2nd segment of the blue fractal.
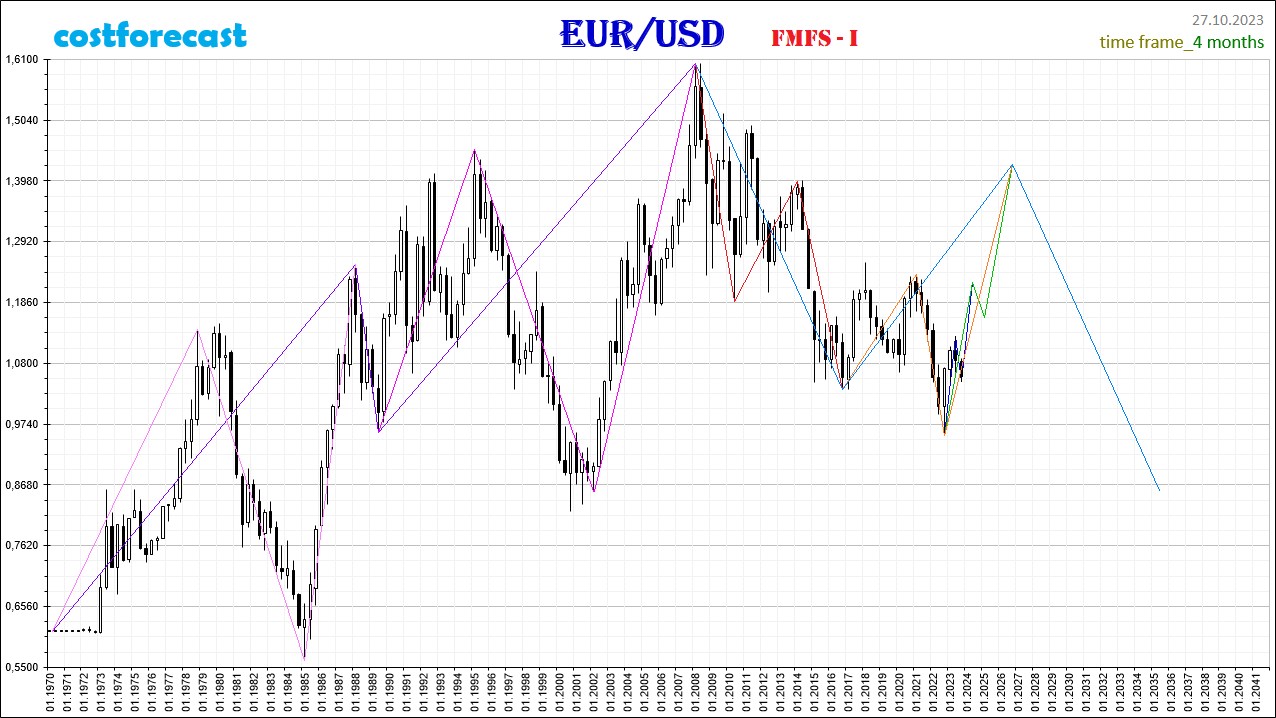
As of October 27, 2023, the most likely model for the future dynamics of quotes of the EUR/USD currency pair is a model that assumes the formation of a fractal in the fractal structure of the chart, indicated in blue on the chart (Fig. 33). At the moment, we can assume the completion of the 2nd segment of the blue fractal and the formation of the 3rd segment, the completion of which can take place in the vicinity of the point with coordinates (07/28/2024; 1.2227).
The blue fractal formed in this way on the time interval (09/25/2022; 07/28/2024) will represent the 1st segment of the fractal of a unit higher order, which is indicated in green on the graph. The growth of quotes for the EUR/USD currency pair will stop at 1.2227 and the quotes will begin to decline due to the fact that the 2nd segment of the green fractal will be formed in the fractal structure, which is indicated on the chart by a fractal of one lesser order in pink. If everything happens as indicated, then the subsequent dynamics of EUR/USD quotes after 04/13/2025 will take place in an upward trend as part of the formation of the 3rd segment of the green fractal.
If you are interested in modeling the dynamics of value in the financial market using fractal geometry tools, then look for current models of possible future dynamics of quotations of financial assets on our website costforecast or on social networks.
In the end, I note that it is not for me to give advice on how and how much to earn. Everyone must think for themselves and make their own decisions and be responsible for them.
My advice on how to make a million is not about money. I advise those involved in investing in the financial market to pay attention to the Niro Method, which allows you to model the future dynamics of value in the financial market and effectively manage market risk.
I am confident that the Niro Method will take its rightful place among your technical analysis tools and will be able to qualitatively complement fundamental analysis.
