10,000 USD per troy ounce is the future value of gold. Consider a model of the upcoming dynamics of gold quotes until 2040.
The trigger for the explosive growth of gold quotes is hyperinflation. Taking into account the current situation in the global economy, it can be assumed that already this year, 2022, the cost of gold will double and grow from the current 1,800 USD per troy ounce to 3,600 USD.
In this case, after a sharp increase, an equally sharp correction will follow, as a result of which the quotes will drop from 3,600 USD to 2,900 USD.
If the situation develops in this way, then the growth of gold quotes from the level of 2,900 USD will continue in the direction of 10,000 USD per troy ounce.
A description of the method for modeling the dynamics of value in the financial market is given in the article “When will Dow be Low?”. You can get acquainted with the ABC for reading charts in the short video “The Alphabet of Niro Attractors”.
To build a future model of the dynamics of gold quotes, it is necessary to determine which global fractal structures are formed, that is, to find all the fractals of its components on the chart and determine, by combining them, the possible fractal structures of various orders formed by them.
The abbreviation FMFS stands for forecast model of fractal structure.
FMFS-I - probability of realization 75% -100%;
FMFS-II - probability of realization 50% -75%;
FMFS-III - probability of realization 25% -50%;
FMFS-IV - probability of realization 0% -25%.
Below is one of the possible models of the upcoming dynamics of the price of gold, the implementation of which as of May 13, 2022 has a high degree of probability.
We will determine the global fractal structure on the charts of the following time frames: 1 month, 2 months, 3 months, 4 months, half a year and a year. Let's start the definition of fractals from 1970, when the price of gold was 35 USD per troy ounce.
Let's consider what fractals can be marked on charts with a time frame of 1 month.
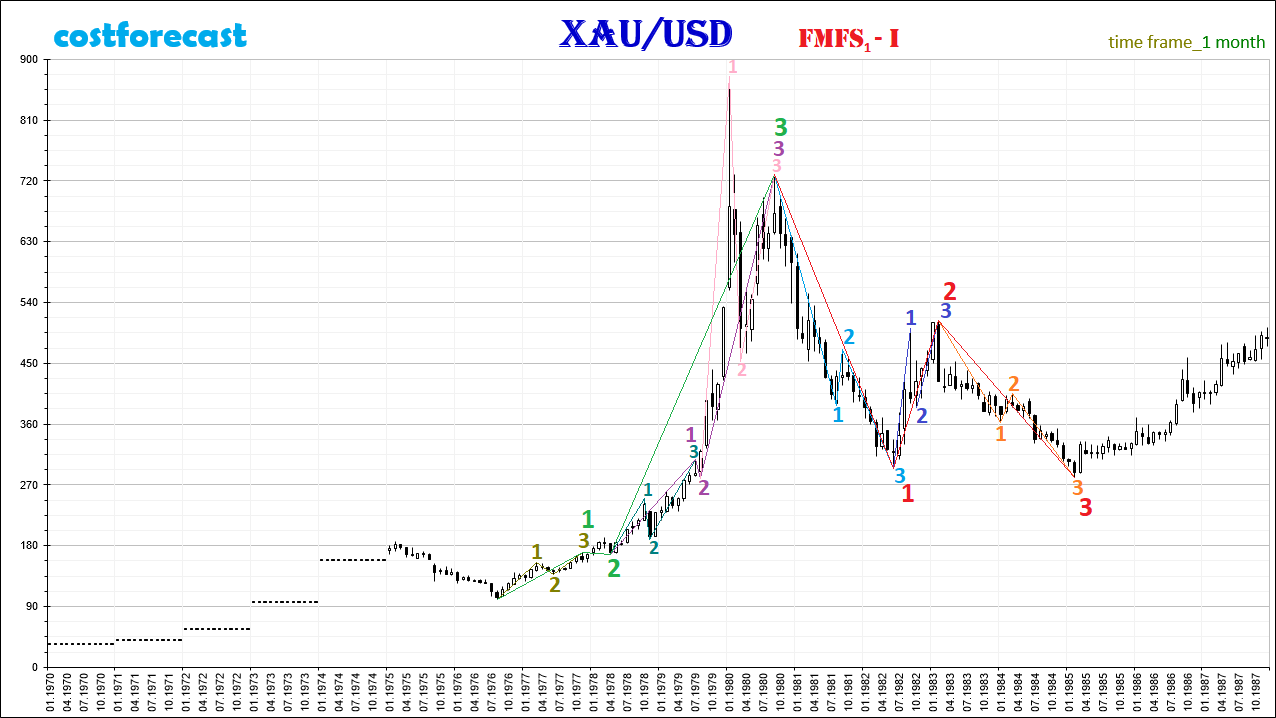
Figure 1 shows the following formed fractals:
The F21 fractal on the time interval T(08.1976; 11.1976) is marked in olive color;
The F12 fractal on the time interval T(04.1978; 07.1979) is marked in turquoise;
The F33 fractal on the time interval T(08.1979; 09.1980) is indicated in light pink;
The F32 fractal on the time interval T(09.1980; 06.1982) is marked in blue;
The F33 fractal on the time interval T(06.1982; 02.1983) is marked in dark blue;
The F21 fractal on the time interval T(02.1983; 02.1985) is marked in orange.
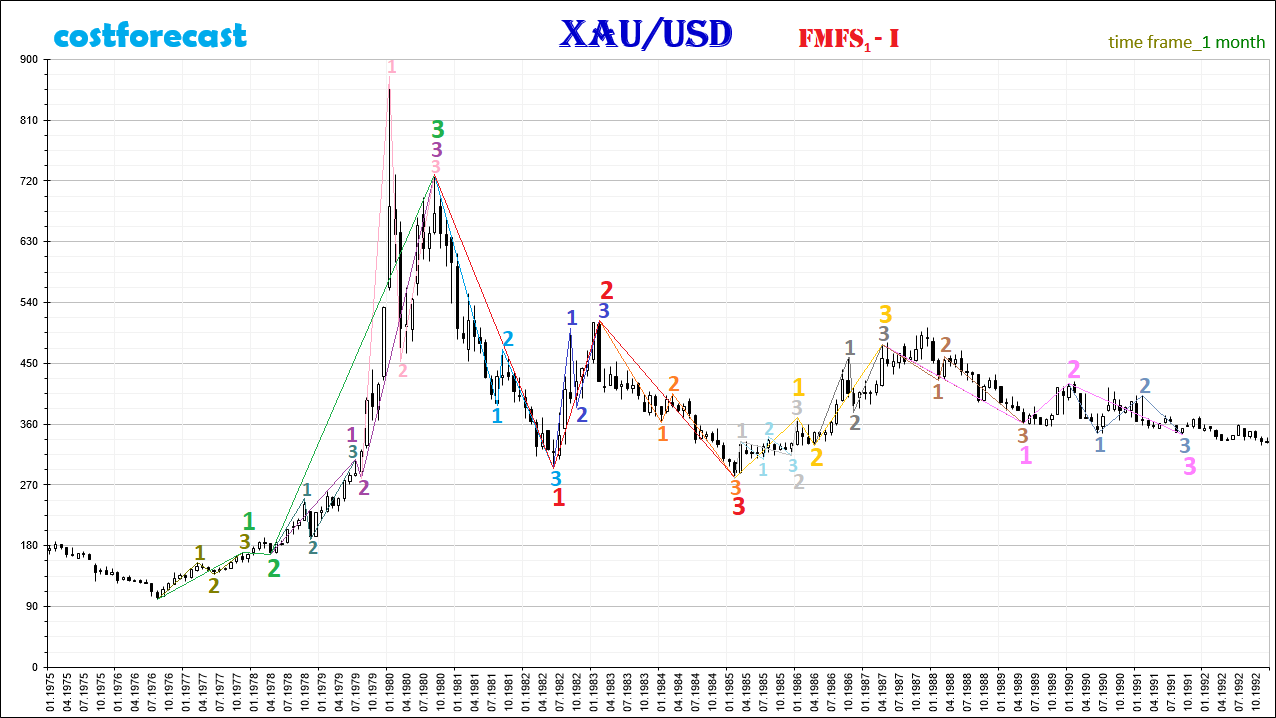
Figure 2 shows the following formed fractals:
The F24 fractal on the time interval T(03.1985; 12.1985) is indicated in pale blue;
The F21* fractal on the time interval T(02.1985; 01.1986) is marked in light gray;
The F22 fractal on the time interval T(04.1986; 04.1987) is marked in dark gray;
The F12 fractal on the time interval T(04.1987; 05.1989) is marked in light brown;
The F23 fractal on the time interval T(01.1990; 09.1991) is marked with steel color.
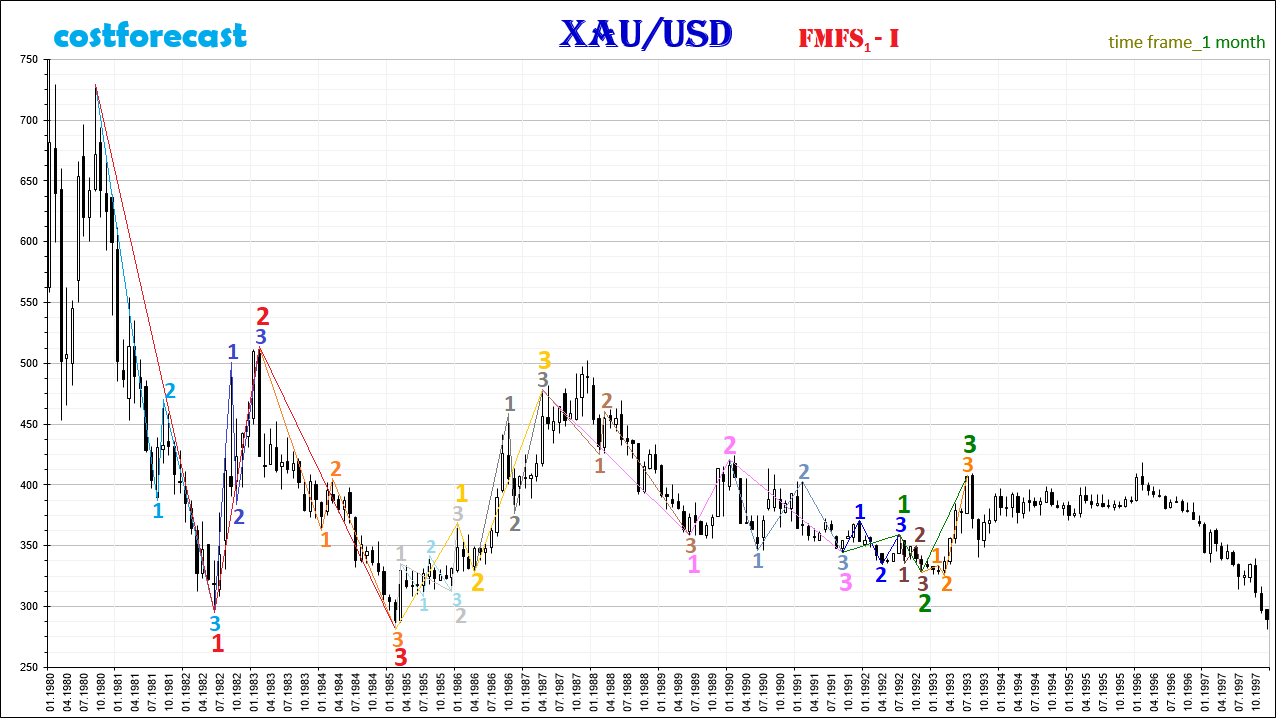
Figure 3 shows the following formed fractals:
The F24 fractal on the time interval T(09.1991; 07.1992) is marked in blue;
The F22 fractal on the time interval T(07.1992; 11.1992) is shown in brown;
The F14 fractal on the time interval T(11.1992; 07.1993) is marked in bright orange.
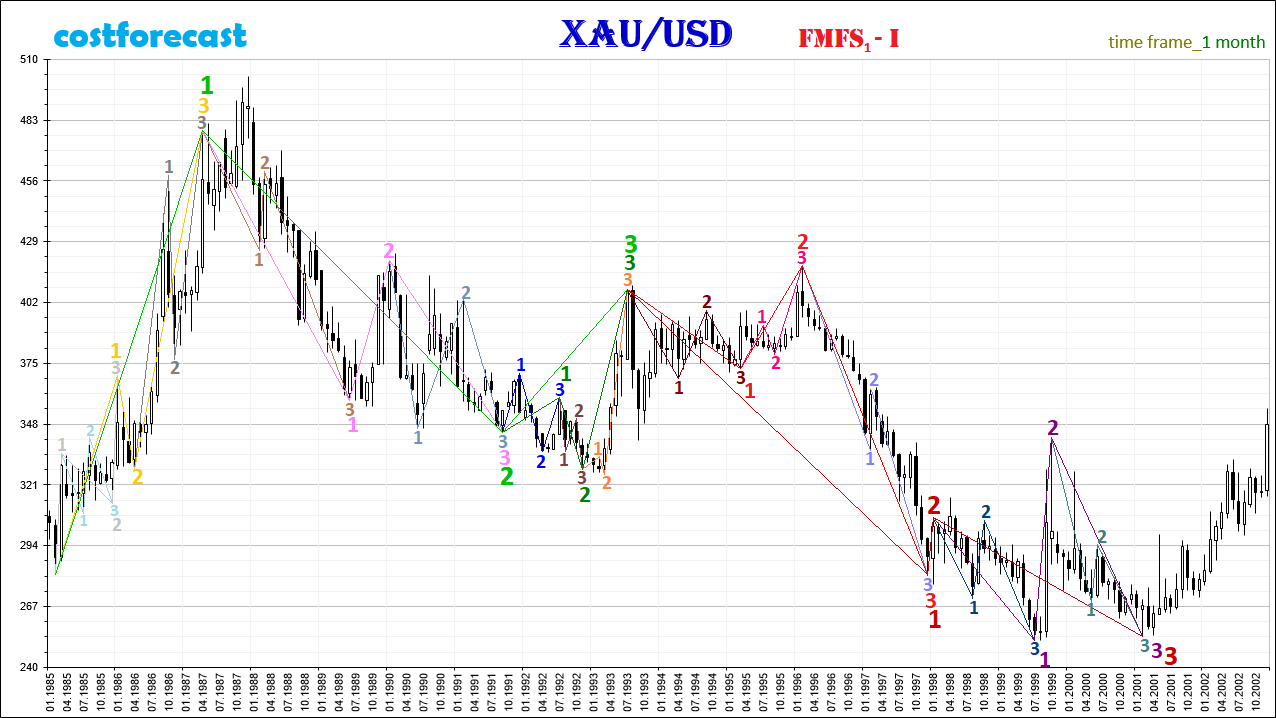
Figure 4 shows the following formed fractals:
The F33 fractal on the time interval T(07.1993; 03.1995) is marked in dark brown;
The F12 fractal on the time interval T(03.1995; 02.1996) is marked in dark pink;
The F21 fractal on the time interval T(02.1996; 12.1997) is marked in cornflower blue;
The F13 fractal on the time interval T(01.1998; 07.1999) is indicated in brown-blue;
The F33 fractal on the time interval T(10.1999; 02.2001) is indicated in brown-gray.
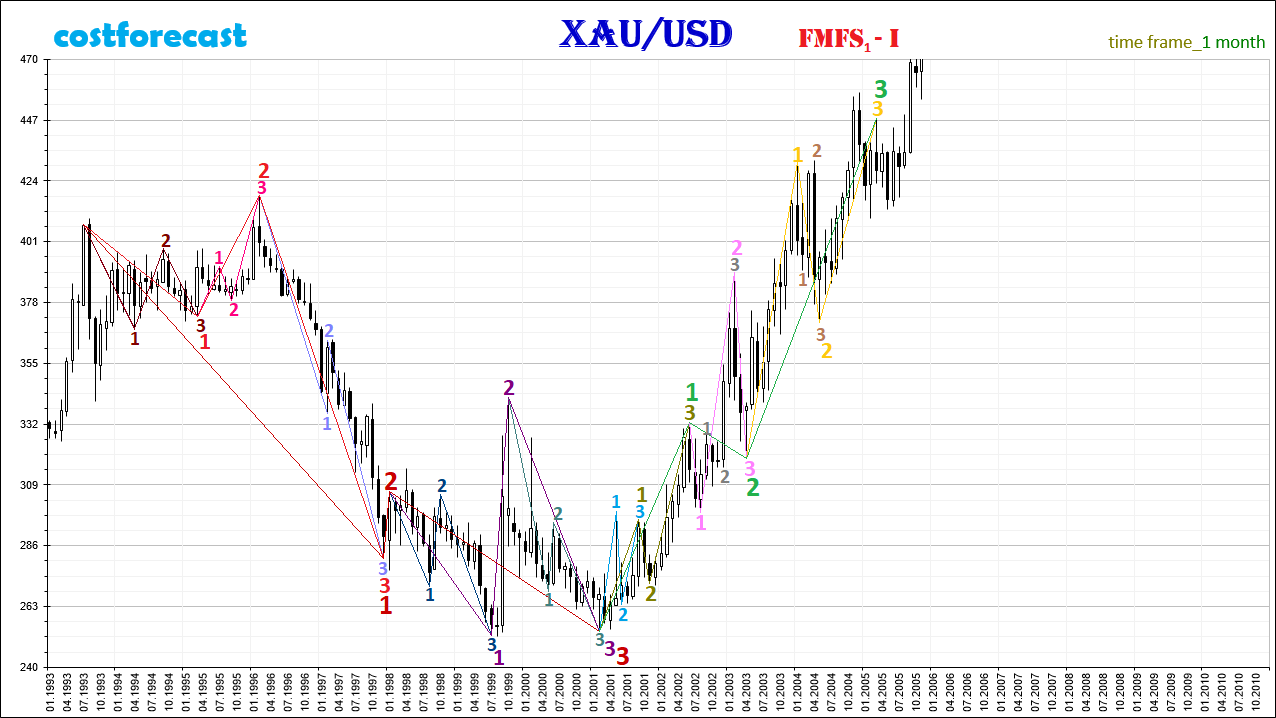
Figure 5 shows the following formed fractals:
The F23 fractal on the time interval T(02.2001; 09.2001) is marked in blue;
The F12 fractal on the time interval T(02.2001; 06.2002) is marked in olive color;
The F24 fractal on the time interval T(06.2002; 04.2003) is marked in light pink;
The F33 fractal on the time interval T(04.2003; 03.2005) is marked in yellow.
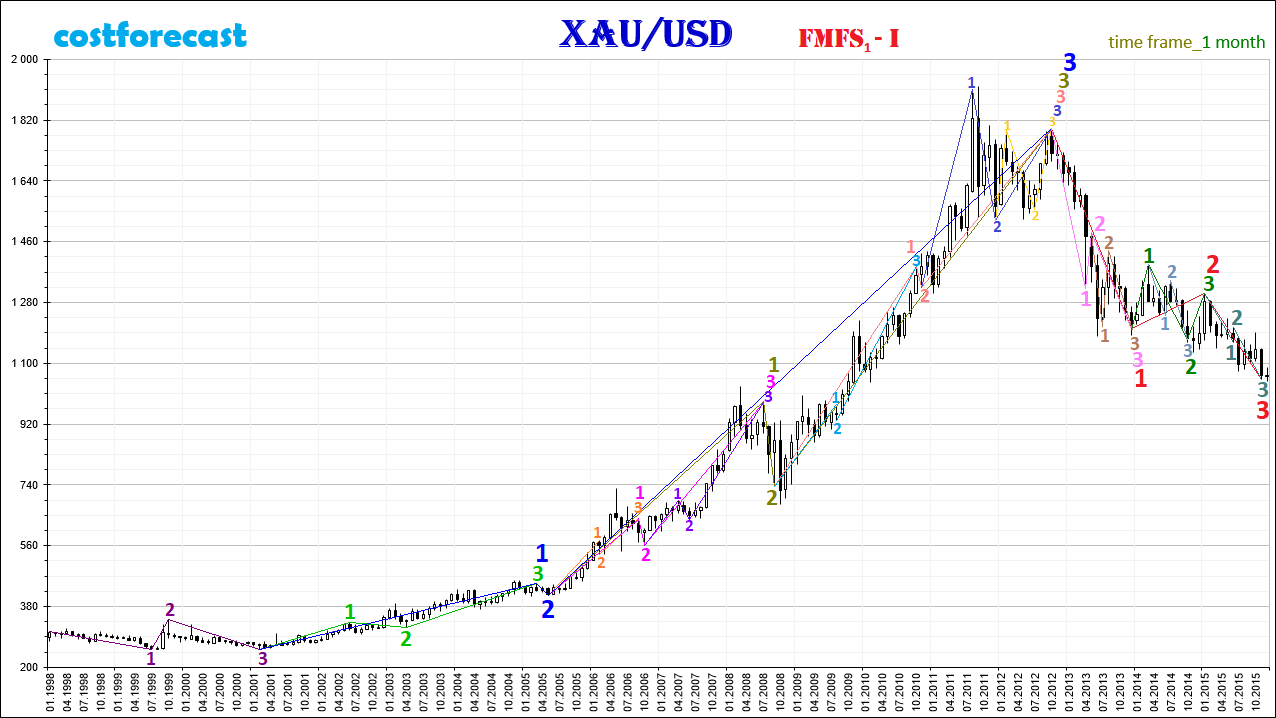
Figure 6 shows the following formed fractals:
The F31 fractal on the time interval T(05.2005; 09.2006) is marked in orange;
The F11 fractal on the time interval T(10.2006; 07.2008) is marked in light purple;
The fractal F11{31-MS-11} on the time interval T(05.2005; 07.2008) is marked in pink;
The F11 fractal on the time interval T(09.2008; 10.2010) is marked in blue;
The F33 fractal on the time interval T(11.2010; 10.2012) is marked in dark blue;
The fractal F31{11-MS-33} on the time interval T(09.2008; 10.2012) is marked in coral;
The F23 fractal on the time interval T(12.2011; 10.2012) is marked in yellow;
The F32 fractal on the time interval T(10.2012; 12.2013) is marked in pink;
The F23 fractal on the time interval T(05.2013; 12.2013) is marked in light brown;
The F24 fractal on the time interval T(12.2013; 01.2015) is marked in dark green;
The F22 fractal on the time interval T(03.2014; 01.2015) is indicated in brown-gray;
The F21 fractal on the time interval T(01.2015; 11.2015) is marked in turquoise.
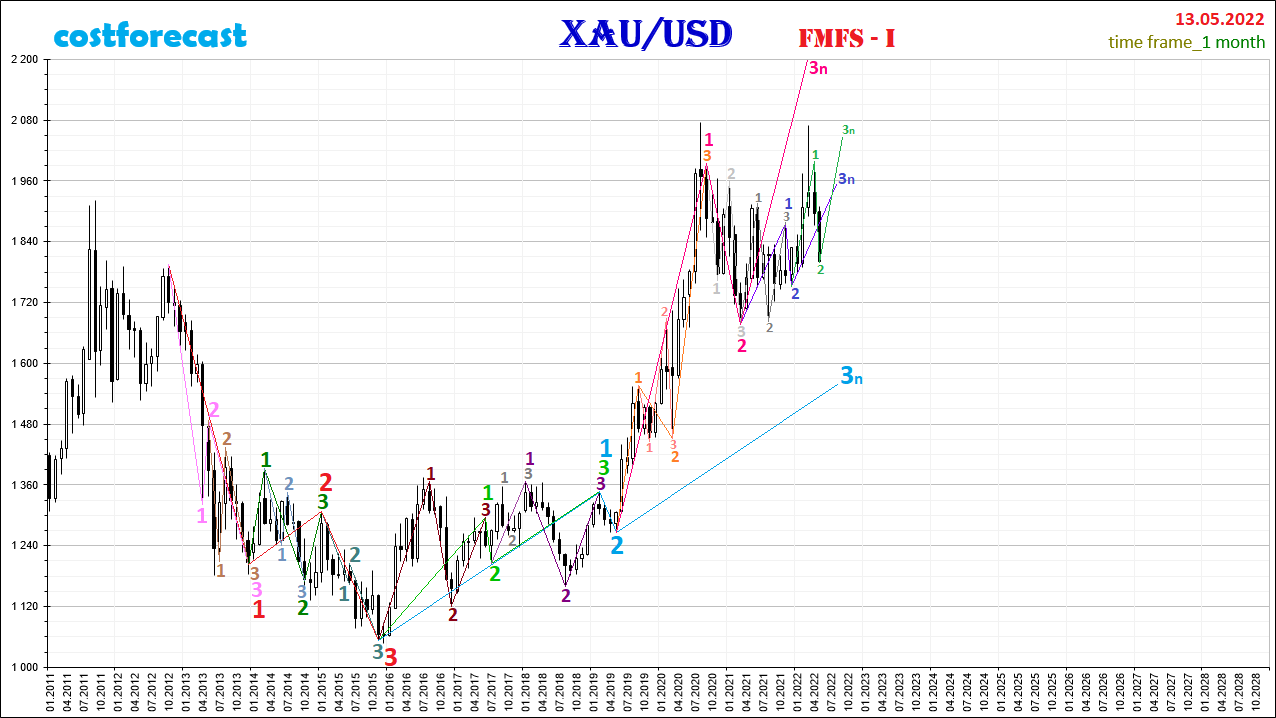
Figure 7 shows the following formed fractals:
The F33 fractal on the time interval T(11.2015; 06.2017) is marked in dark brown;
The F24 fractal on the time interval T(07.2017; 02.2019) is marked in dark purple;
The F12 fractal on the time interval T(05.2019; 09.2020) is marked in orange;
The F24 fractal on the time interval T(09.2019; 02.2020) is marked in coral;
The F13 fractal on the time interval T(09.2020; 03.2021) is indicated in light gray;
The F23 fractal on the time interval T(03.2021; 11.2021) is marked in dark gray.
Fractals of small orders form fractals of large orders forming fractal structures. Fractal structures of higher orders consist of fractal structures of lower orders. Combinations of fractals and fractal structures of various orders give an understanding of what global fractal structures are formed or can be formed.
Let's consider what fractals can be marked on charts with a time frame of 2 months.
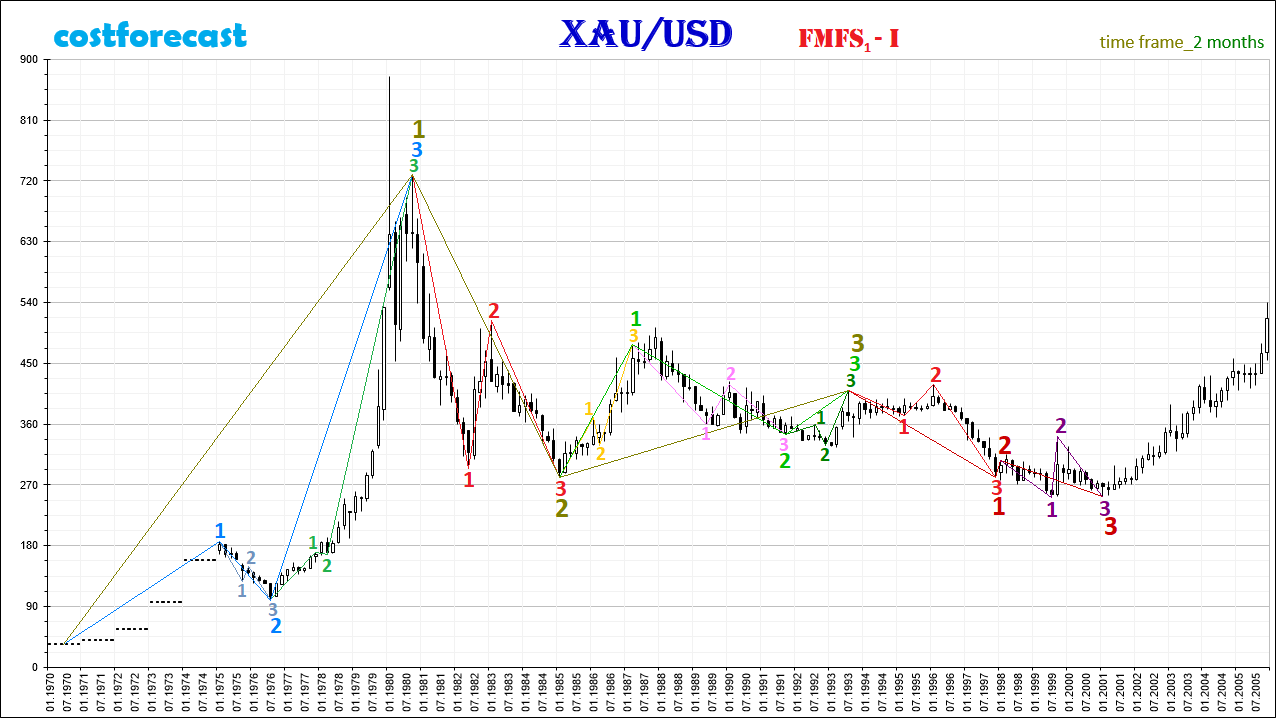
Figure 8 shows the following formed fractals:
The F21 fractal on the time interval T(1/6.1975; 4/6.1976) is marked with steel color;
The F11 fractal on the time interval T(4/6.1900; 5/6.1980) is marked in green;
The F12{MS-21-11} fractal on the time interval T(3/6.1970; 5/6.1980) is marked in light blue;
The F33 fractal on the time interval T(5/6.1980; 1/6.1985) is marked in red;
The F12 fractal on the time interval T(1/6.1985; 2/6.1987) is marked in yellow;
The F33 fractal on the time interval T(2/6.1987; 5/6.1991) is marked in pink;
The F14 fractal on the time interval T(5/6.1991; 4/6.1993) is marked in dark green;
The fractal F23{12-33-14}* on the time interval T(1/6.1985; 4/6.1993) is marked in bright green;
The F14 fractal on the time interval T(4/6.1993; 6/6.1997) is marked in red;
The F24 fractal on the time interval T(1/6.1998; 1/6.2001) is marked in purple;
The fractal F31{14-MS-24} on the time interval T(4/6.1993; 1/6.2001) is marked in burgundy.
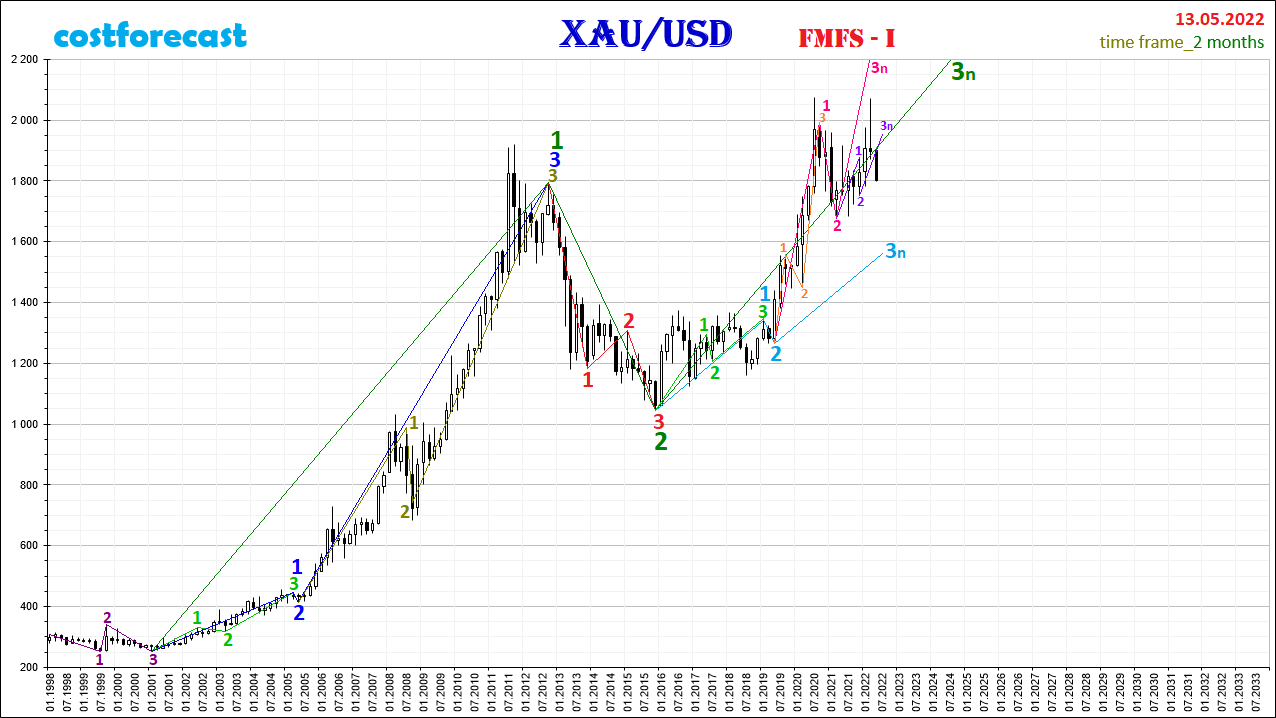
Figure 9 shows the following formed fractals:
The F11 fractal on the time interval T(1/6.2001; 3/6.2002) is marked in bright green;
The F12 fractal on the time interval T(2/6.2005; 5/6.2012) is marked in olive color;
The F32 fractal on the time interval T(5/6.2012; 6/6.2015) is marked in red;
The F31 fractal on the time interval T(6/6.2015; 1/6.2019) is marked in light green;
The F12 fractal on the time interval T(3/6.2019; 5/6.2020) is marked in orange.
Let's consider what local fractal structures can be marked on the charts with a time frame of 3 months.
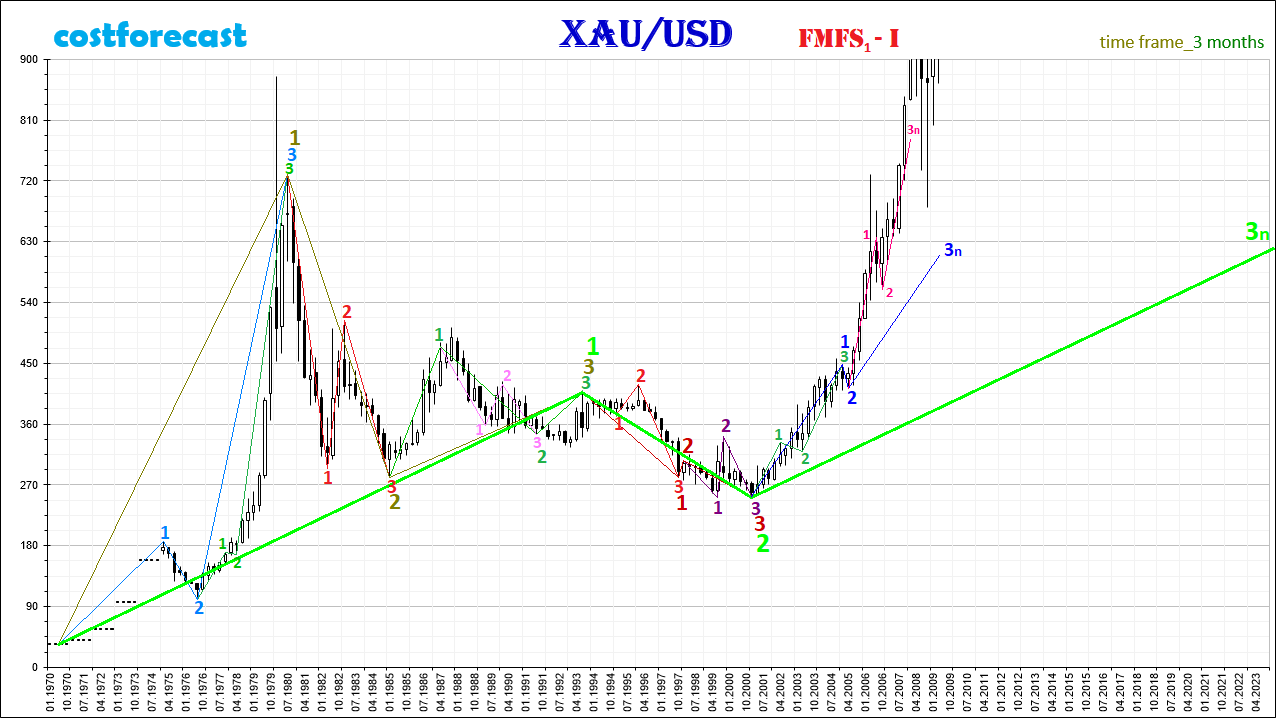
Figure 10 shows the following formed fractals:
The F11 fractal on the time interval T(3/4.1976; 3/4.1980) is marked in light green;
The F32 fractal on the time interval T(2/4.1987; 3/4.1991) is marked in pink;
The F12 fractal on the time interval T(2/4.1970; 3/4.1980) is marked in blue;
The F33 fractal on the time interval T(3/4.1980; 1/4.1985) is marked in red;
The F23* fractal on the time interval T(1/4.1985; 3/4.1993) is marked in green;
The F13 fractal on the time interval T(3/4.1993; 4/4.1997) is marked in red;
The F24 fractal on the time interval T(1/4.1998; 1/4.2001) is marked in purple;
The F12 fractal on the time interval T(1/4.2001; 1/4.2005) is marked in brown-green.
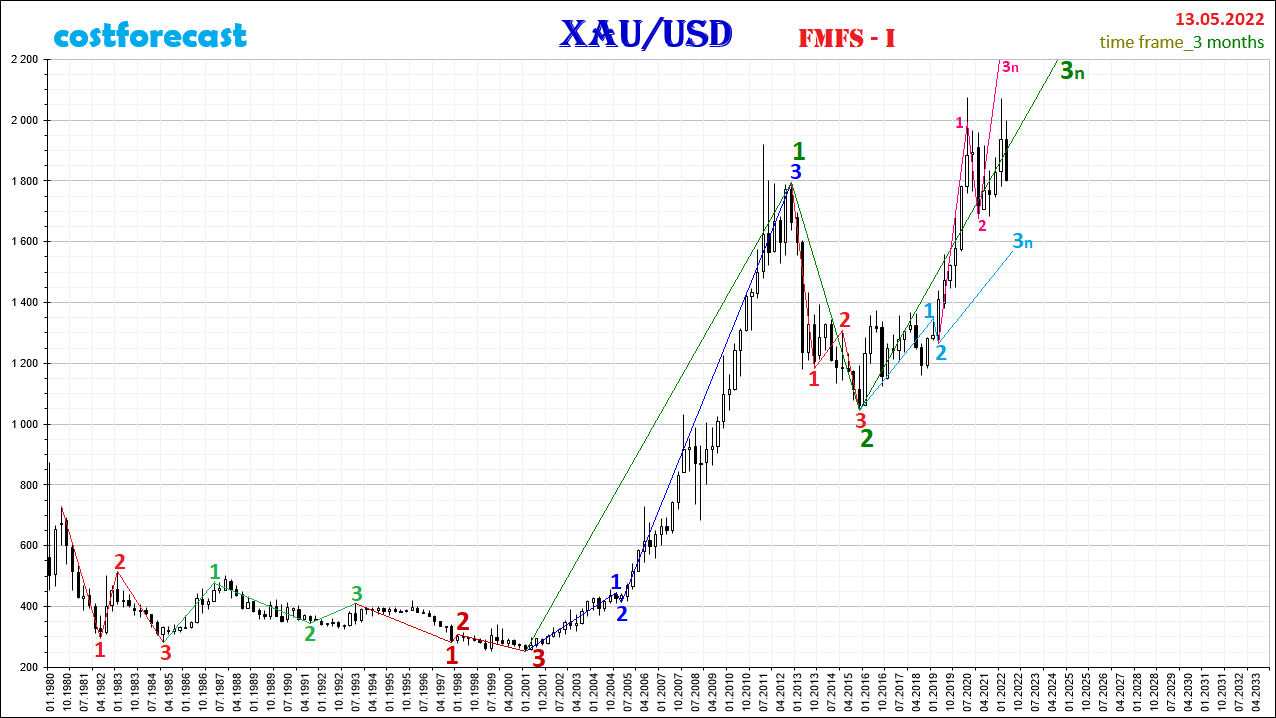
Figure 11 shows the following formed fractals:
The F33 fractal on the time interval T(3/4.1980; 1/4.1985) is marked in red;
The F23* fractal on the time interval T(1/4.1985; 3/4.1993) is marked in green;
The F31 fractal on the time interval T(3/4.1993; 1/4.2001) is marked in burgundy;
The F11 fractal on the time interval T(1/4.2001; 4/4.2012) is marked in blue;
The F32 fractal on the time interval T(4/4.2012; 4/4.2015) is marked in red.
Let's consider which local fractal structures can be marked on charts with a 4-month timeframe.
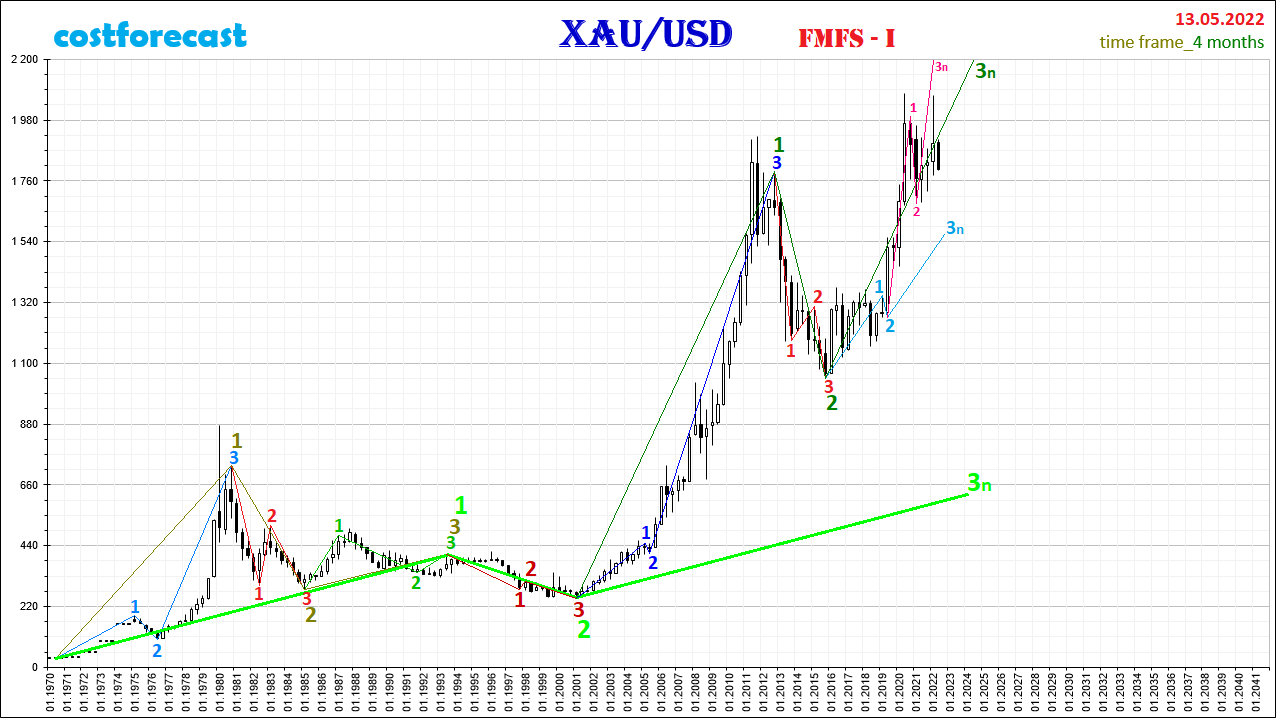
Figure 12 shows the following formed fractals:
The F12 fractal on the time interval T(2/3.1970; 3/3.1980) is marked in blue;
The F33 fractal on the time interval T(3/3.1980; 1/3.1985) is marked in red;
The F23* fractal on the time interval T(1/3.1985; 2/3.1993) is marked in green;
The fractal F35{12-33-23*} on the time interval T(2.3.1970; 2/3.1993) is marked in olive color;
The F31 fractal on the time interval T(2/3.1993; 1/3.2001) is marked in burgundy;
The F11 fractal on the time interval T(1/3.2001; 3/3.2012) is marked in blue;
The F32 fractal on the time interval T(3/3.2012; 3/3.2015) is marked in red.
On a chart with a time frame of six months, the fractal structure will look like this.
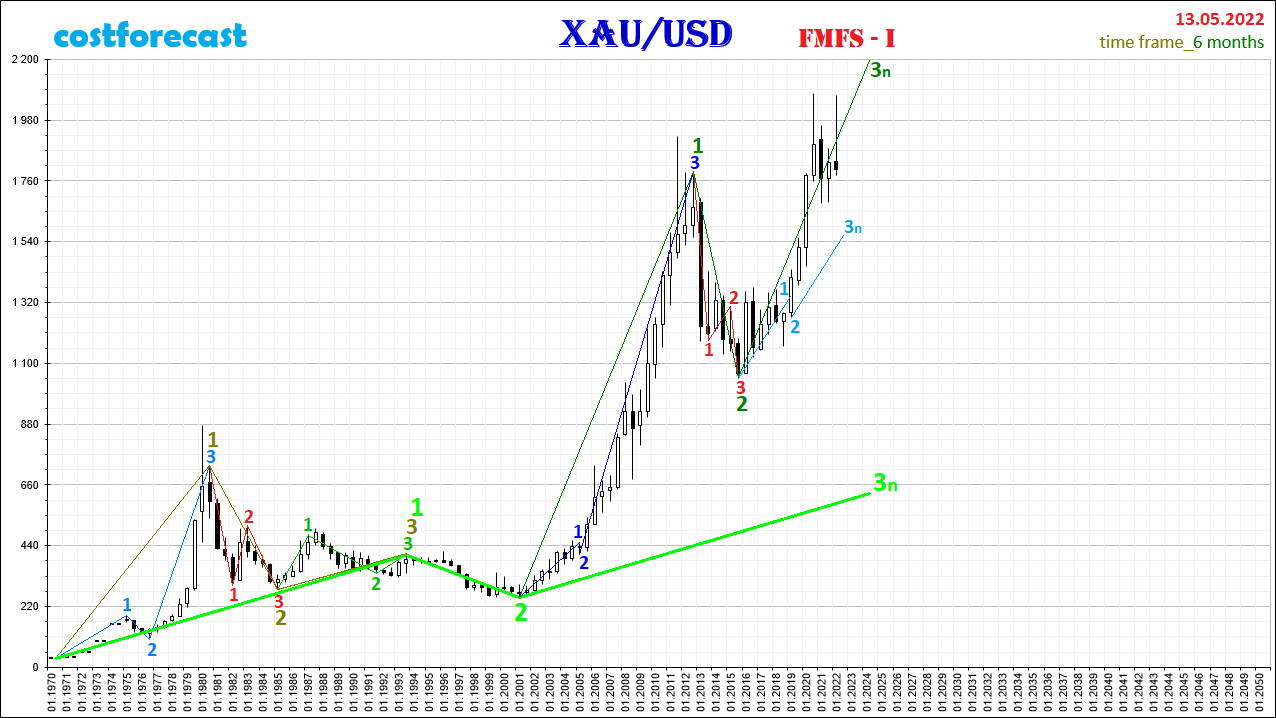
Figure 13 shows the following formed fractals:
The F12 fractal on the time interval T(2/2.1970; 2/2.1980) is marked in blue;
The F33 fractal on the time interval T(2/2.1980; 1/2.1985) is marked in red;
The F23* fractal on the time interval T(1/2.1985; 2/2.1993) is marked in green;
The fractal F35{12-33-23*} on the time interval T(2/2.1970; 2/2.1993) is marked in olive color;
The F11 fractal on the time interval T(1/2.2001; 2/2.2012) is marked in blue;
The F32 fractal on the time interval T(2/2.2012; 2/2.2015) is marked in red.
Let's consider the global fractal structure on a chart built with a time frame of 1 year.
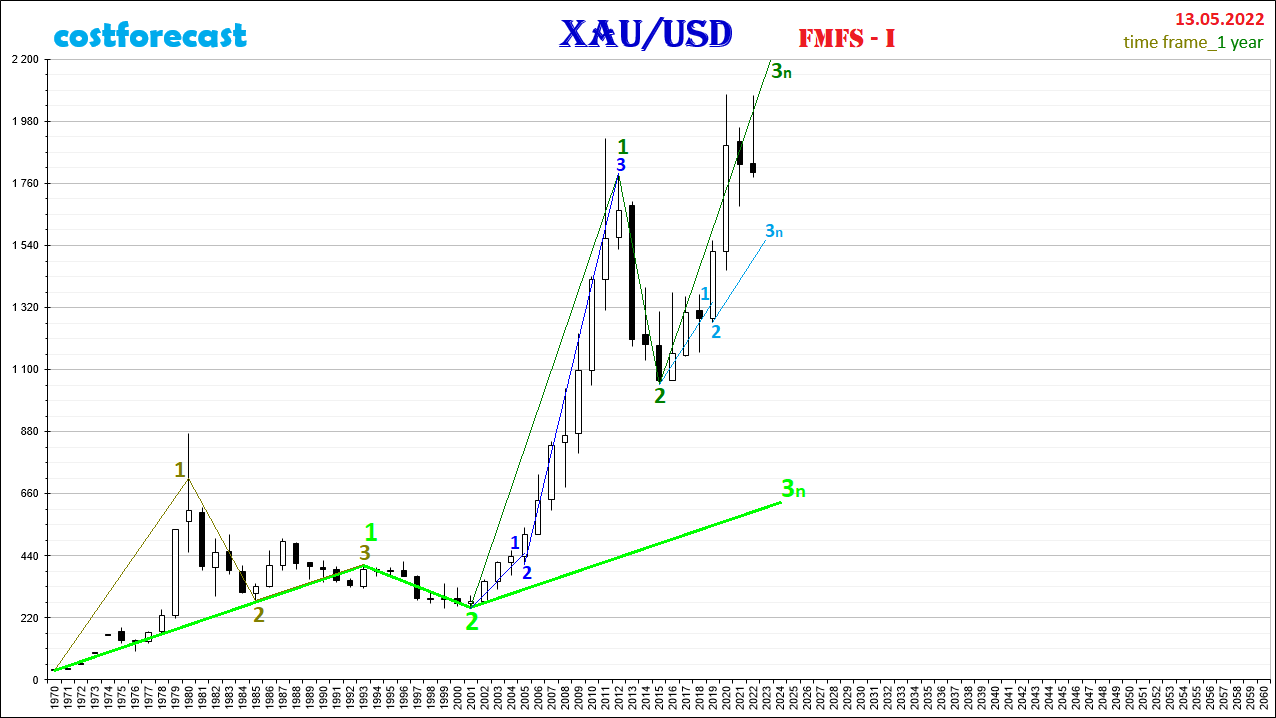
Figure 14 shows the global fractal structure of the gold price dynamics chart, which began to form in 1970.
As of May 13, 2022, it can be assumed that a global fractal is forming, which is indicated in lime.
The 1st segment of this global fractal was formed on the time interval T(1970; 1993) in the form of the F23 fractal (2nd view, 3rd type), which is lower by one order and is marked with olive color on the chart.
The 2nd segment of this global fractal was formed on the time interval T(1993; 2001).
The 3rd segment of the global fractal began to form in 2001 and is in the process of its formation. On the chart, this 3rd segment is indicated by a fractal of a smaller order in dark green.
The 1st and 2nd segments of the dark green fractal have already been formed. The 1st segment was formed on the time interval T(2001; 2012) in the form of an F11 fractal (view 1, type 1), and the 2nd segment was formed on the time interval T(2012; 2015).
According to the global fractal structure of the chart, the current dynamics of gold quotes is within the formation of the 3rd segment of the dark green fractal, which began to form in 2015. This means that the uptrend will continue.
Consider the model of the upcoming dynamics of gold quotes on the charts of smaller time frames.
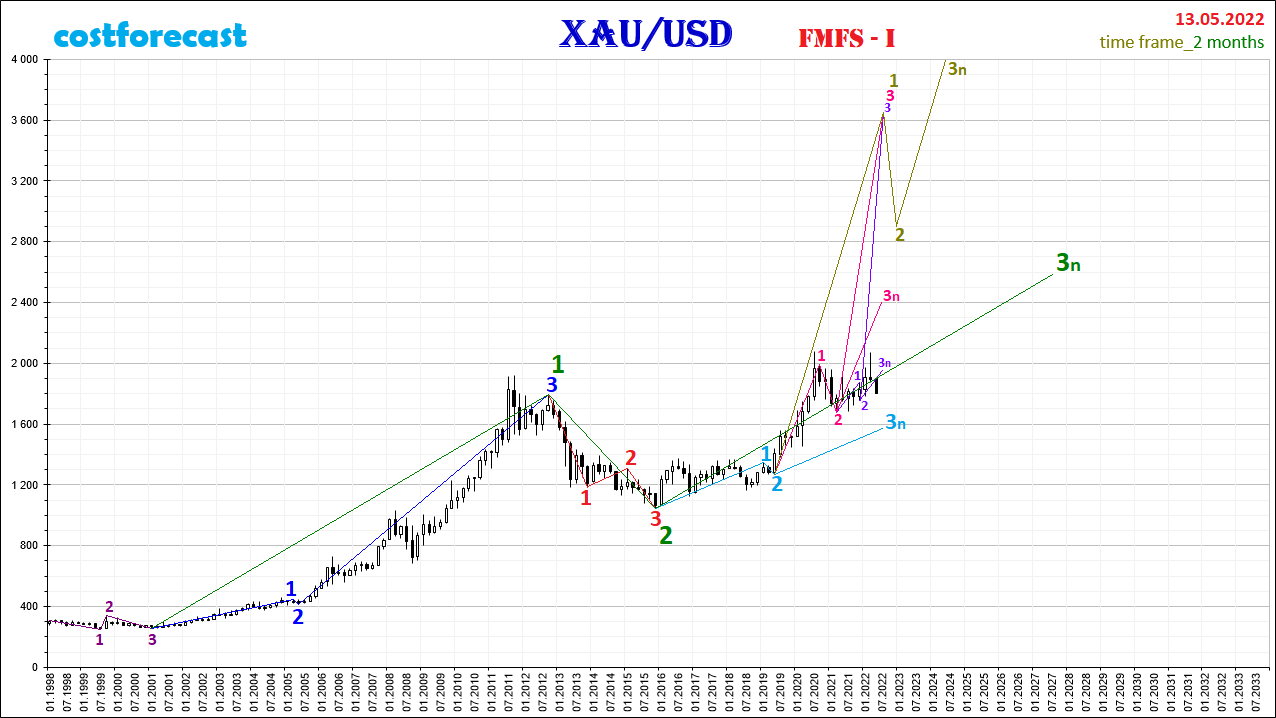
Figure 15 shows the formation of a dark green fractal. The 1st segment of the dark green fractal is indicated by a fractal of a lower order in blue. The 2nd segment of the dark green fractal is indicated by a red fractal of a smaller order.
The 3rd segment of the dark green fractal is in the process of its formation. As of May 13, 2022, it can be assumed that this 3rd segment will form in the form of a fractal, which is indicated in blue.
The 1st segment of the blue fractal was formed on the time interval T(6/6/2015; 1/6/2019), and the 2nd segment of the blue fractal was formed on the time interval T(1/6/2019; 3/6/2019). In this case, the current dynamics of quotes is in the process of forming the 3rd segment of the blue fractal, which has an order of one less than the dark green fractal.
The 3rd segment of the blue fractal is indicated on the chart by an olive fractal. With this in mind, we can say that the current dynamics takes place simultaneously both within the formation of the 3rd segment of the dark green fractal, and within the formation of the 3rd segment of the blue fractal and within the formation of the 1st segment of the olive fractal.
The 1st segment of the olive fractal is indicated on the chart by a dark pink fractal, the completion of which will be the completion of a light purple fractal. Given the increase in volatility in the financial market, the 3rd segment of the light purple fractal may end at 3,660 USD at the end of summer 2022.
Thus, at 3’660 USD, with the completion of the purple fractal, the dark pink fractal will also complete, which will form the 1st segment of the olive fractal. After that, a corrective movement down to the level of 2,900 USD will follow as part of the formation of the 2nd segment of the olive fractal.
Let's consider the continuation of the dynamics of quotes within the formation of the 3rd segment of the olive fractal on the chart with a time frame of 3 months.
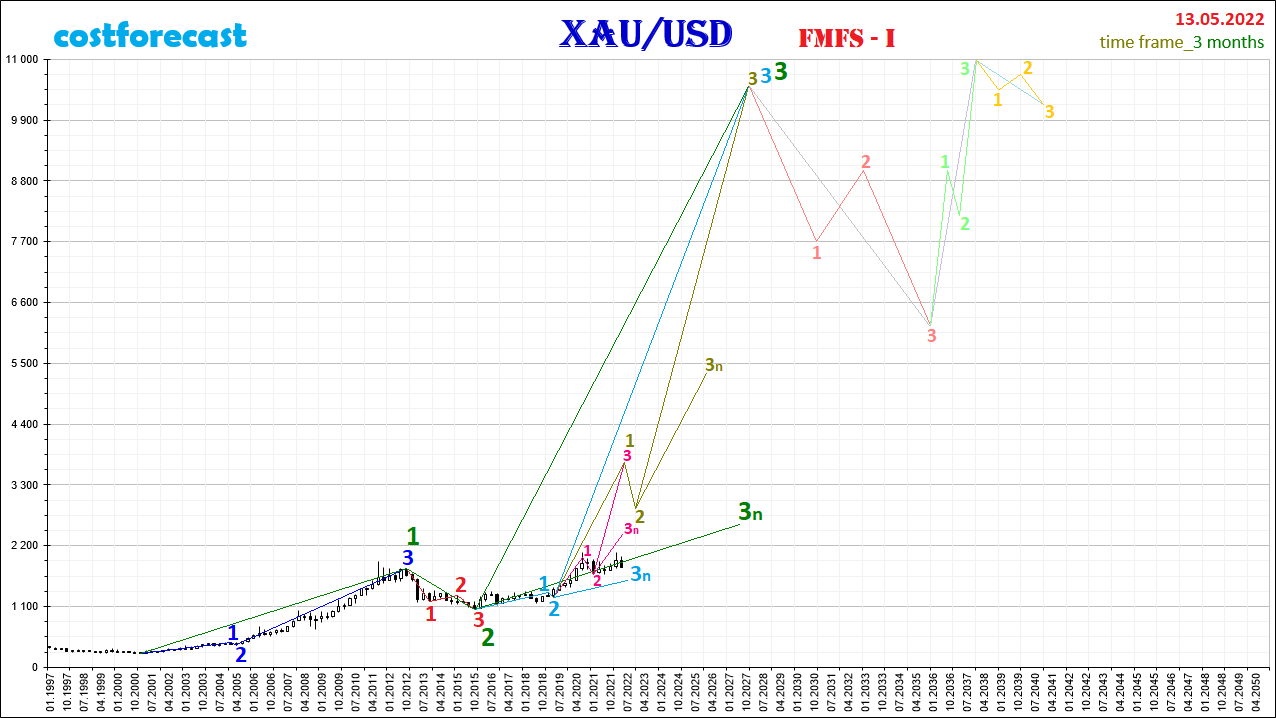
Figure 16 shows that after a downward corrective movement from 3’660 USD to 2’900 USD, an explosive growth of quotations above 10’500 USD will follow as part of the formation of the 3rd segment of the olive fractal.
In this case, in 2027, the olive fractal will complete, which in turn is the 3rd segment of the fractal one order of magnitude higher, which is indicated in blue.
This blue fractal will represent the 3rd segment of the dark green fractal. This global dark green fractal will form on the time interval T(2021; 2027) and will have an order that is one higher than the blue fractal, 2 units higher than the olive fractal and 3 units higher than the fractal, which marked in dark pink.
Let's consider the position of this dark green fractal in the global fractal structure on a chart with a 4-month timeframe.
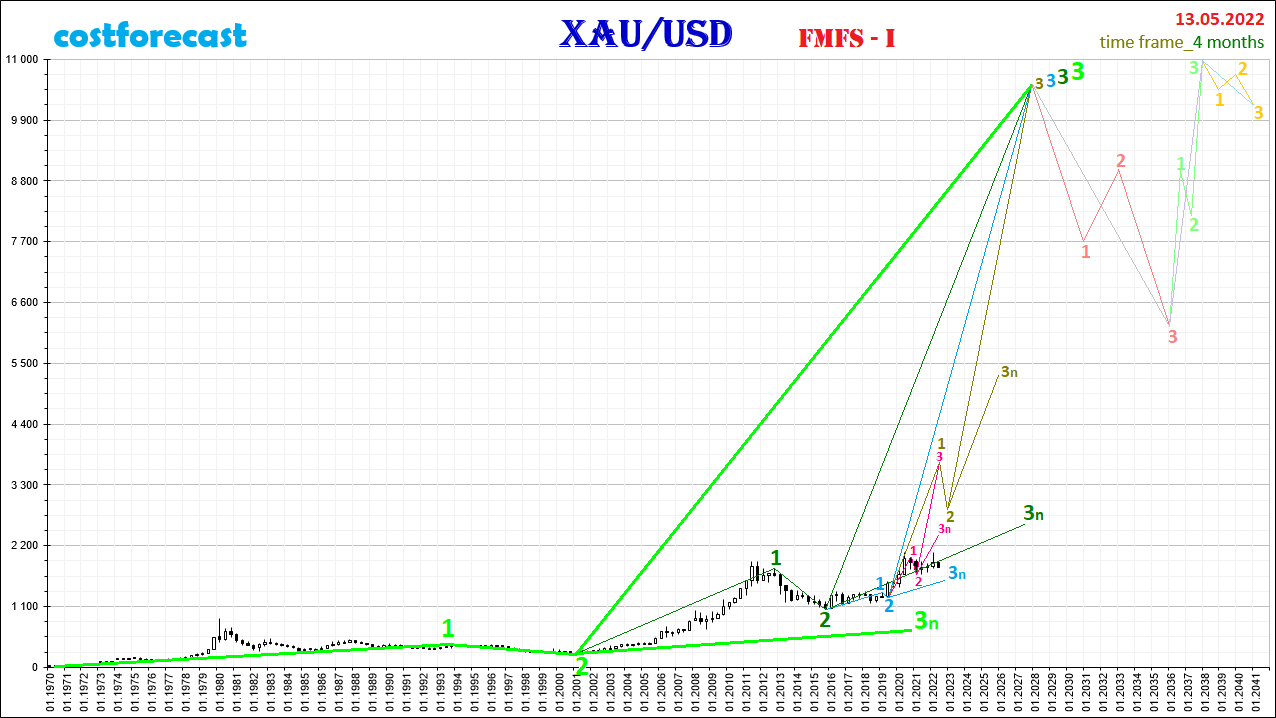
Figure 17 shows that the dark green fractal is the 3rd segment of the higher order fractal, which is marked in lime color on the time interval T(1970; 2027).
Completion of the global fractal in 2027 will mean the end of the uptrend and the beginning of a corrective movement on the time interval T(2027; 2035) as part of the formation of a fractal, which is indicated on the chart in coral color in the cost range P(10’500; 6’200).
After 2035, the dynamics of gold quotes will be ascending to the maximum levels that will be reached in 2027-2028 with their subsequent consolidation.


