

This blog is used to explain the detailed steps to use the Smart Market Structure program and its scanner.
I'll use an example to illustrate the detailed steps to make it easy to understand:
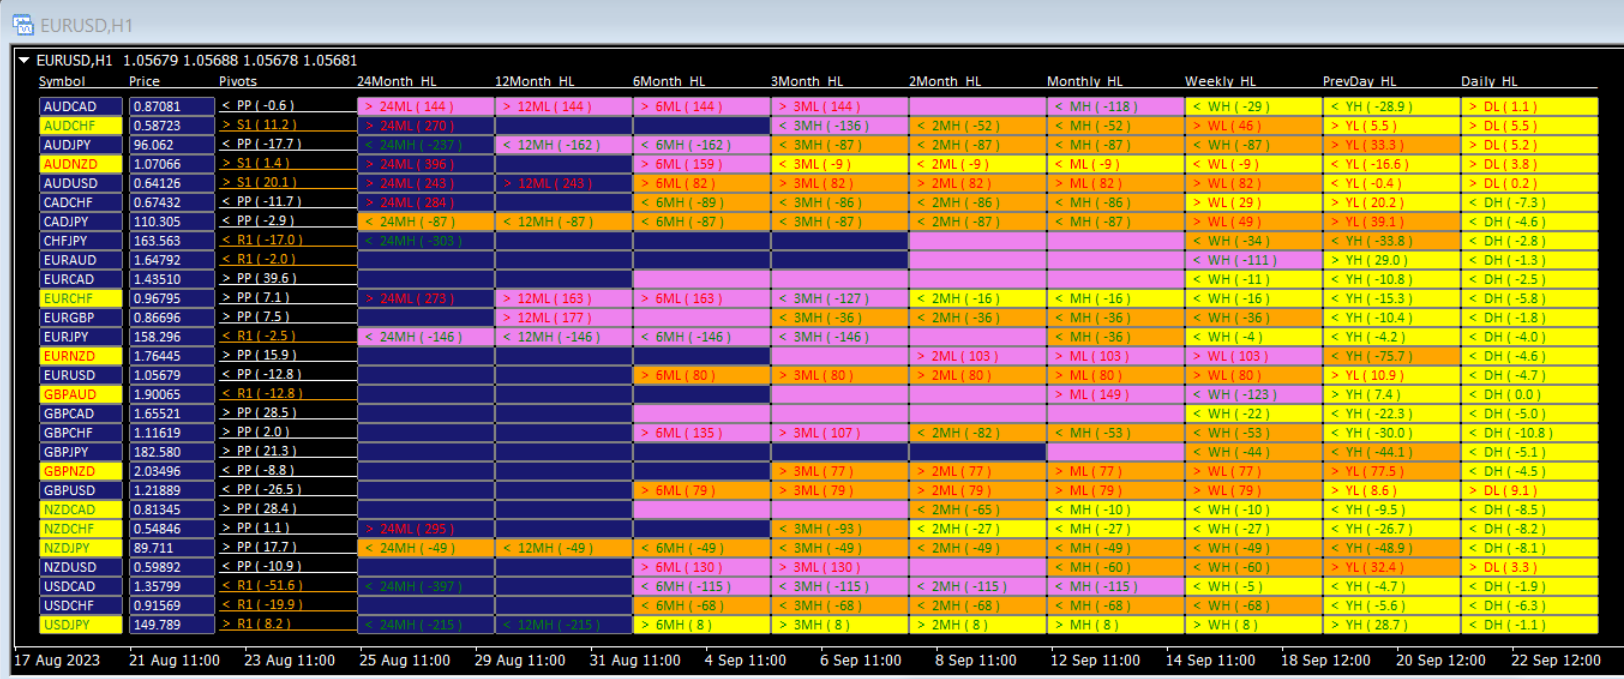
Step 1. Go to the scanner. and look at attached file named "smart-market-structure-opportunity-scanner-1.png".
Step 1.a Look for the row with the most "bright yellow" columns. Of course, you can change the color to your liking in options. For now, the last line has 7 columns with yellow highlights. It's "USDJPY" pair.
The texts on these columns show
"> 6MH( 8 )", "> 3MH( 8 )", "> 2MH( 8 )", "> MH( 8 )", "> WH( 8 )", "> YH( 28.7 )", "< DH( -1.1 )".
It means the current price of USDJPY at 149.78 is above 6 monthly High price for 8 pips. ( also above 3 month high, 2 month high, monthly high, and weekly high price for 8 pips. And above Yesterday's High price for 28.7 pips, and below Today's High price for -1.1 pip.
This one row gives out a lot of accurate information on where price is relatively on bigger timeframes, which is what Institutions use based on Smart Money Concepts.
Step 1.b USDJPY is the pair to choose for watch/entry because it's right at the highest p
rice point of the last 6 months.
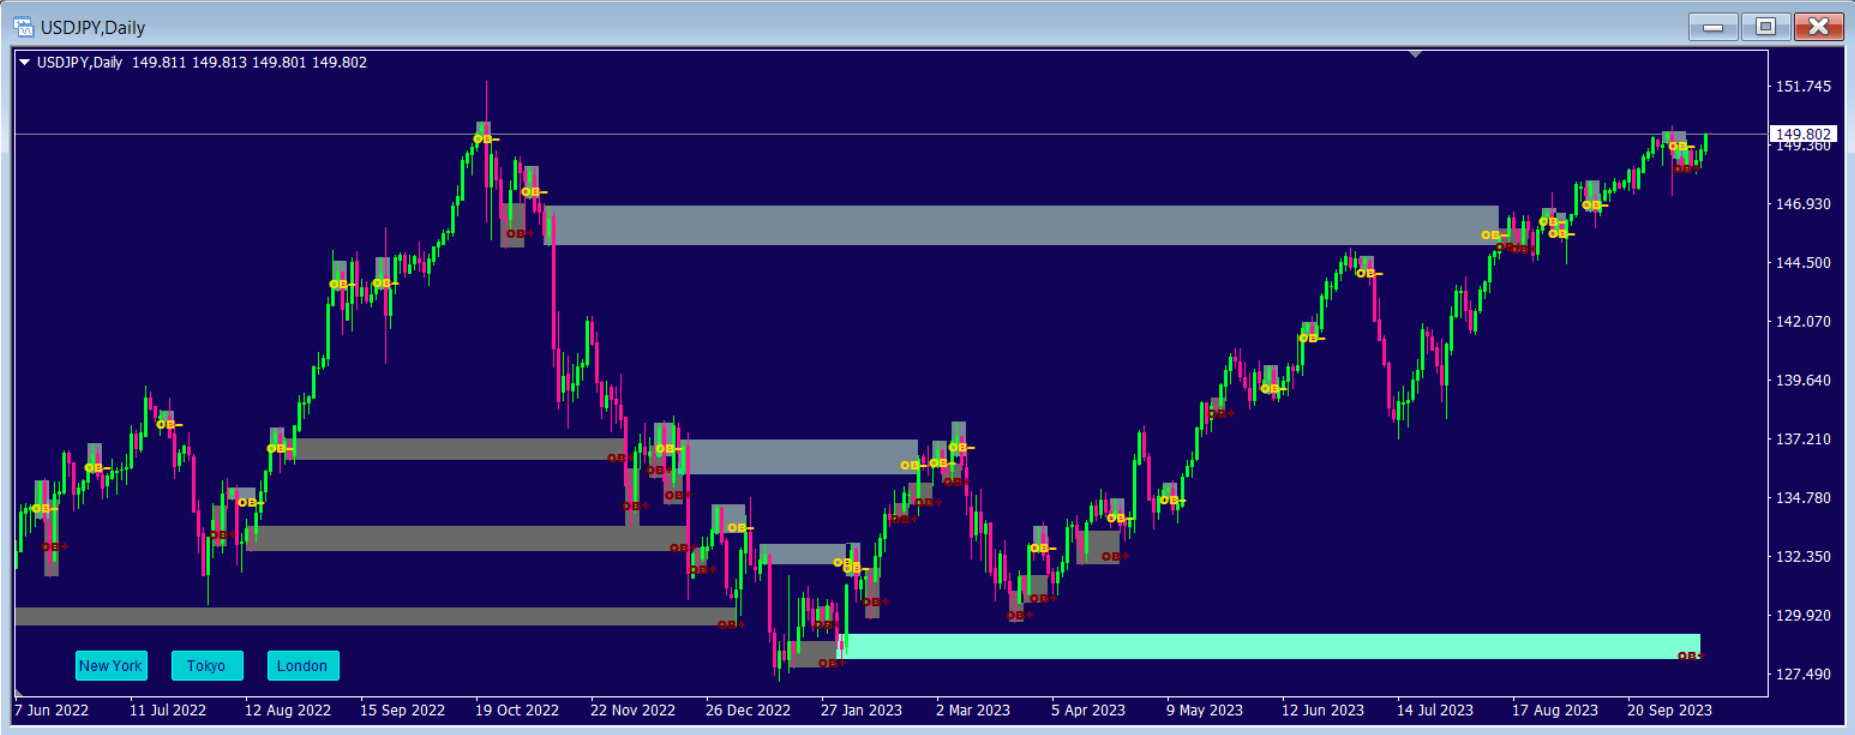
Now we look at the USDJPY chart in detail to verify.
Step 2. Look at the 2nd attached chart file named "USDJPY1.png". It's the daily chart of USDJPY with "Smart Market Structure Lines" program applied on chart. The program has the capacity to show OrderBlocks, Fair Value Gaps, Break of Structure, and Market Structure Shift, and other features on chart as well as lots of other features and options. I only turned on OrderBlocks to show on chart for illustration purposes.
Step 2.a As the chart shows, the last time price hits 149.78 was Oct 21st, 2022, almost 12 months ago. And the Highest price on that day was 151.94, it opened at 150.12. It confirmed the point that indeed the current price of 149.78 was the highest price of last 6 months. And actually the last row, the 2 left columns did show it's 215 pips below its 12 month high, and 24 month high.
Step 2.b Looking at the daily chart in detail, we find that on Oct 21st, 2022, it actually was a 500 point day ( High 151.94 - 146.16 ). 578 pips in one day. And price reversed to the downside for 3 months afterwards ( from Oct 21st, 2022 to Jan 16th, 2023 ). It confirmed again it's the great turning point, and a great pair to watch for entries. No need to wait for long for great opportunities anymore!
Step 2.c I only put on OrderBlocks on chart, and it shows on Oct 20th, 2022, the day before the 500 point move day, it was the Bearish OrderBlock marked on the chart. On this day price opened at 149.84 and the High was 150.28. Based on Smart Money Concepts, it was the last bullish candle before price turned downwards afterwards for 3 months. And it showed on chart ever since, and the Scanner caught it on Oct 2nd, 2023, almost one year later. And we don't have to wait a year, or any day at all to catch these great turning points!
Step 2.d the day of Oct 2nd, 2023's price action, reaching 149.78, confirmed the concept that prices would go back to fulfill the unfilled Bearish OrderBlock before heads down. It's also the "Stop Hunt" which Smart money uses to sweep the stops at this level before turning. The program has the option to turn filled OrderBlocks/FVGs off, or turn them into other colors ( I had grey color on chart when they get filled/touched with later price movements ). You can set it to any color you want on input options.
Now we go to Step 3. How do we take advantage of this great entry opportunities?
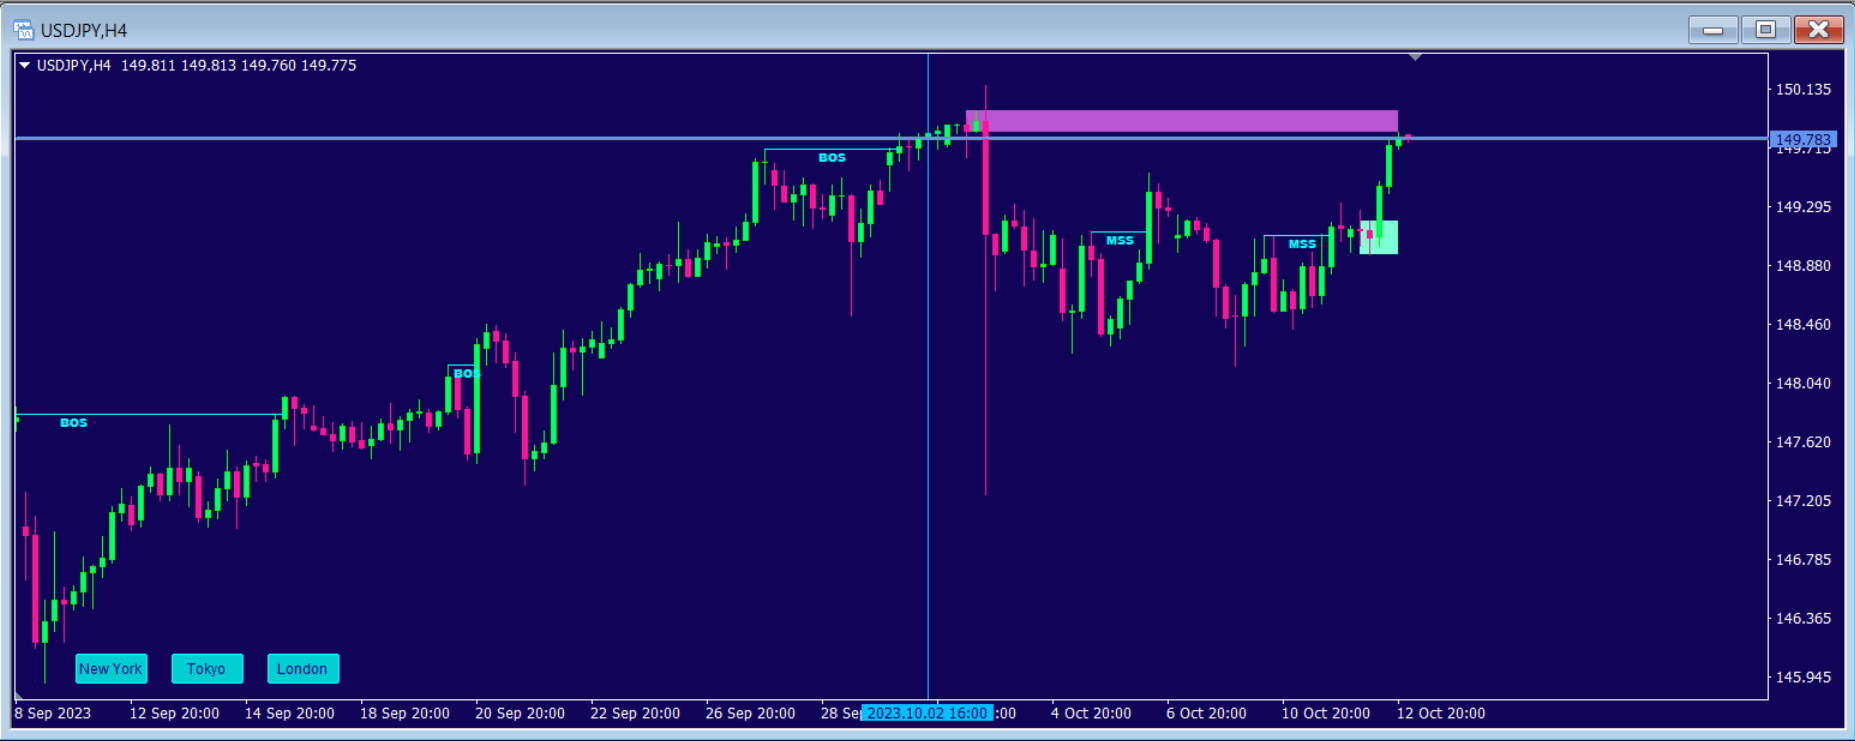
Step 3. Following Smart Money Concepts of Top Down analysis, we go from higher timeframe charts ( Weekly, Daily ), to lower timeframe charts ( 4 hour, 1 hour, etc ). Now look at attached 3rd file named USDJPY-4Hr-chart.png. It's the 4 hour chart of USDJPY of recent price movements. I put a blue crossline on price level of 149.78, on the day of Oct 2nd, 2023 when the Scanner caught it. Apparently, there were 5 more 4-hour bar passed to give user plenty of time to take this opportunity, ( 20 hours or a day of trading time ). So you only need to wait 5 bars before trades goes to your direction!
Step 3.a On Oct 3rd, 2023, USDJPY indeed turned downwards, with High of 150.16 to the Low of 147.27 ( about 297 points move, almost 300 pips in one day! ). This is the amazing power of the scanner, which can find great trading opportunities utilizing the computer's super calculating power we have today. Of course, we all have different personalities and trade different timeframes on different time zones, that's why the scanner shows the pip difference when it gets close to all these longer-term important price levels, the highest and lowest price of 24 months, 12 month, etc, to the last week, and last day. To accommodate these different trading styles.
Step 4. To confirm the validity of the Smart Mondy Concepts, on the 4 Hour chart, because of the sudden movements of 300 pip drop on Oct 3rd, 2023, it created another "Bearish OrderBlock" again on the 4-hour chart, as marked with purple color on chart. and on Oct 12th, 2023, 9 days later, it was filled again. So people who trades lower timeframes ( swing trader or day trader ), can use these unfilled bullish or bearish OrderBlocks, Fair Value Gaps, in the timeframe they prefer, and trade accordingly.
Step 5. The marks of MSS ( Market Structure Shift ) on the chart, shows that the direction of the price movements have turned on the 4-hour chart. To confirm trading direction change on this specific timeframe. One of the hardest things with trading is to deal with multiple timeframes, and with the help of BOS and MSS marks on the chart, it greatly simplifies the process of confirming market direction on specific timeframes.
-------------------------------------------------------------------------------------------------------------------------------------------------
Below are some other example use of the Version 2.0 of the Smart Money Forex Scanner:
Step 1:
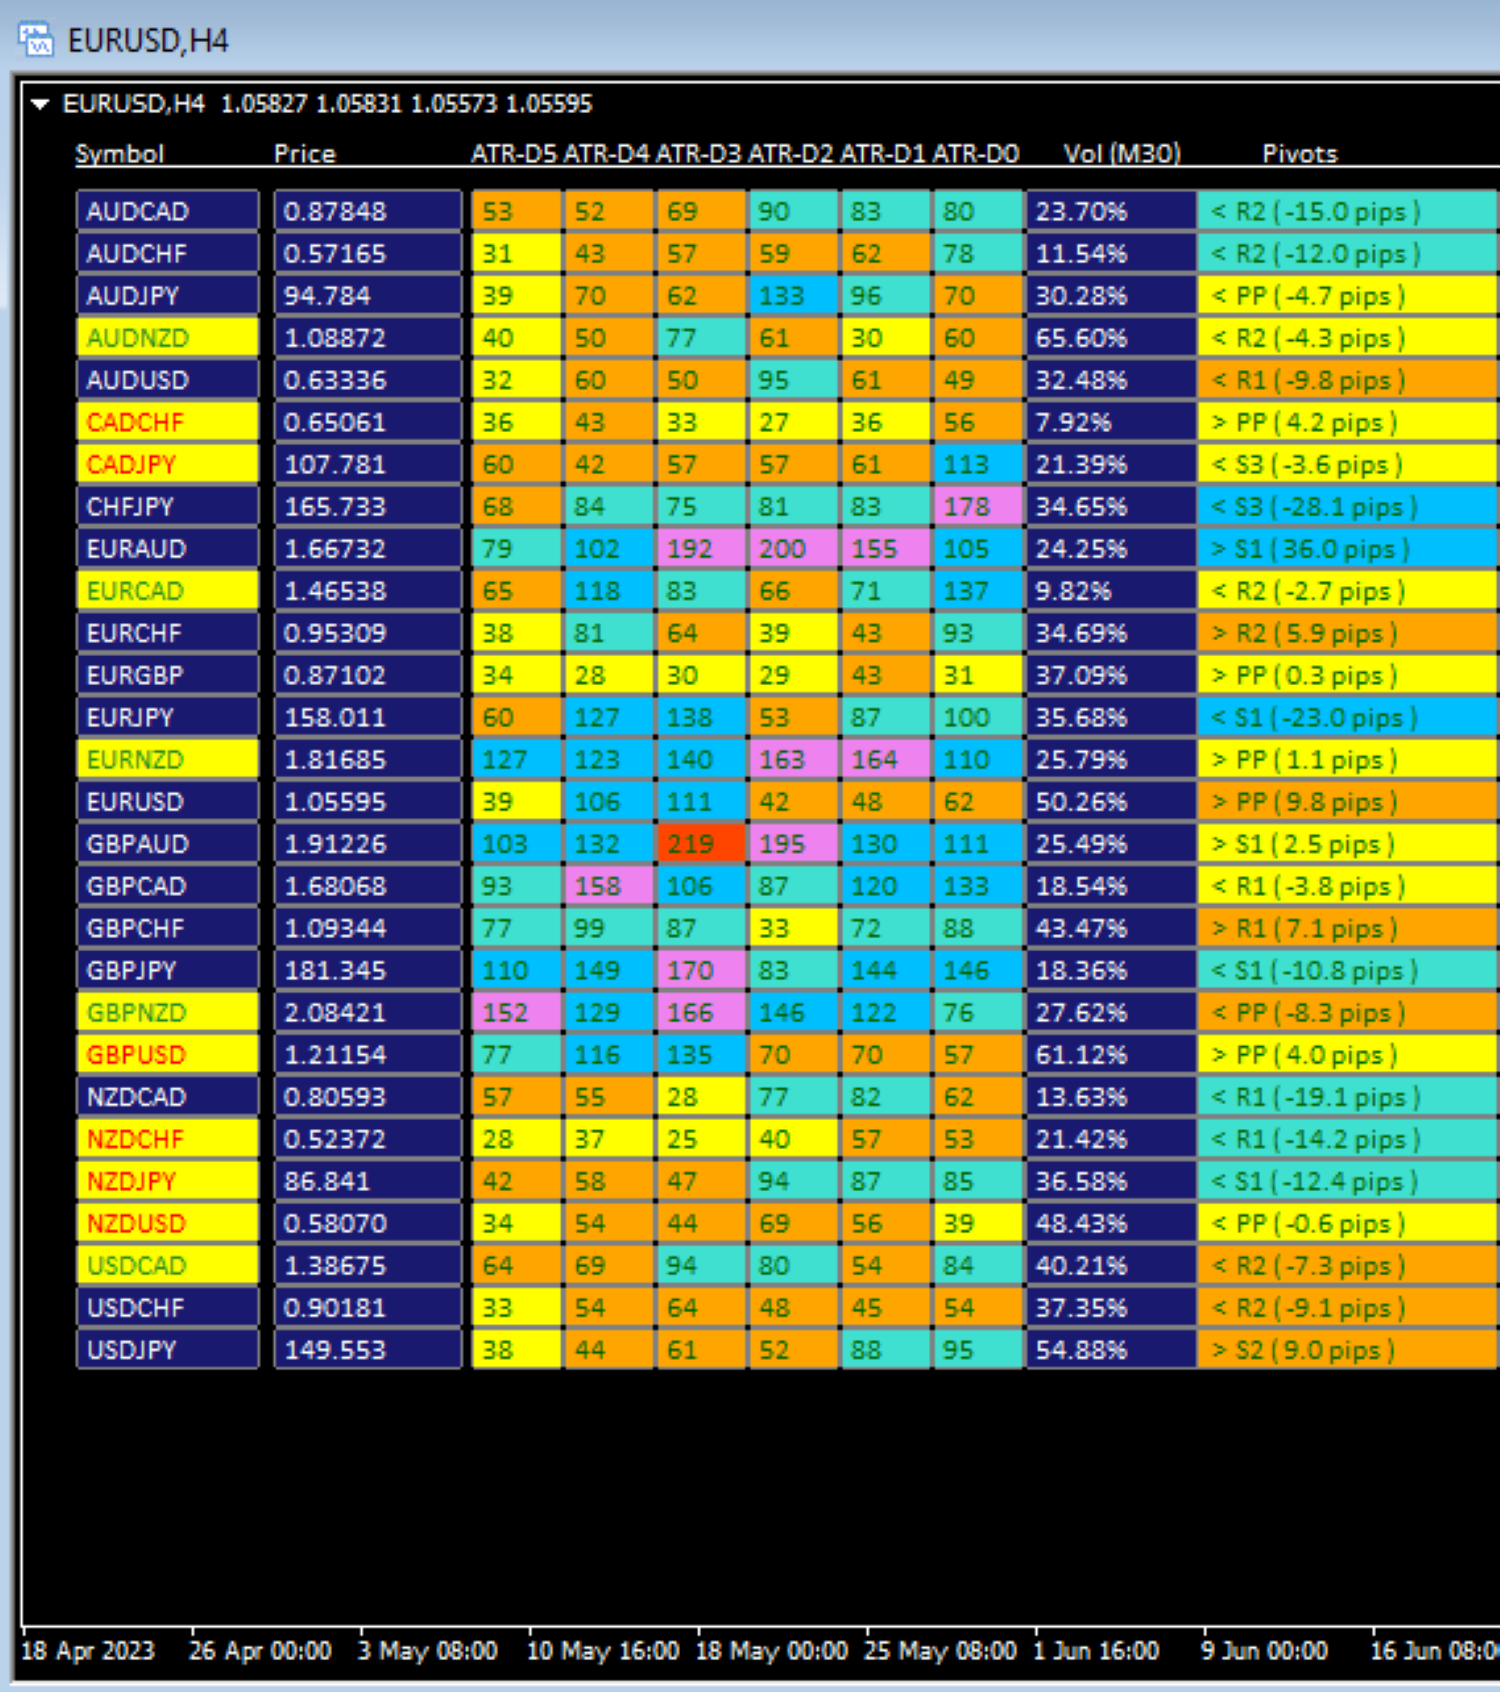
1.a ) 6 extra Columns for 6 days of ATR ( Average True Range ) for the whole week, plus one day were added in the scanner. We could see the maximum price movements for each day for the last 6 trading days for all pairs in the scanner. It can help us pinpoint the pairs that were consolidating in the last few days and would have big impulse move soon. It can also help us pinpoint the pairs that have just finished big impulse moves and may reverse soon.
1.b ) The 4th attached file, named "ATR_example.png", shows the ATR values for the last 6 trading days for all pairs for Oct 27th, 2023. On the chart, I used color Yellow to highlight ATR values that's < 40 pips. The pair NZDCHF has 4 columns that's of Yellow color here, that shows the ADR is < 40 for the 1st 4 trading days. => It means this pair is consolidating in these 4 trading days. It means, we can expect the pair to have big impulse move soon. The last 2 trading days, the ATRs for NZDCHF is 57 and 53. It confirmed the impulse move has started.
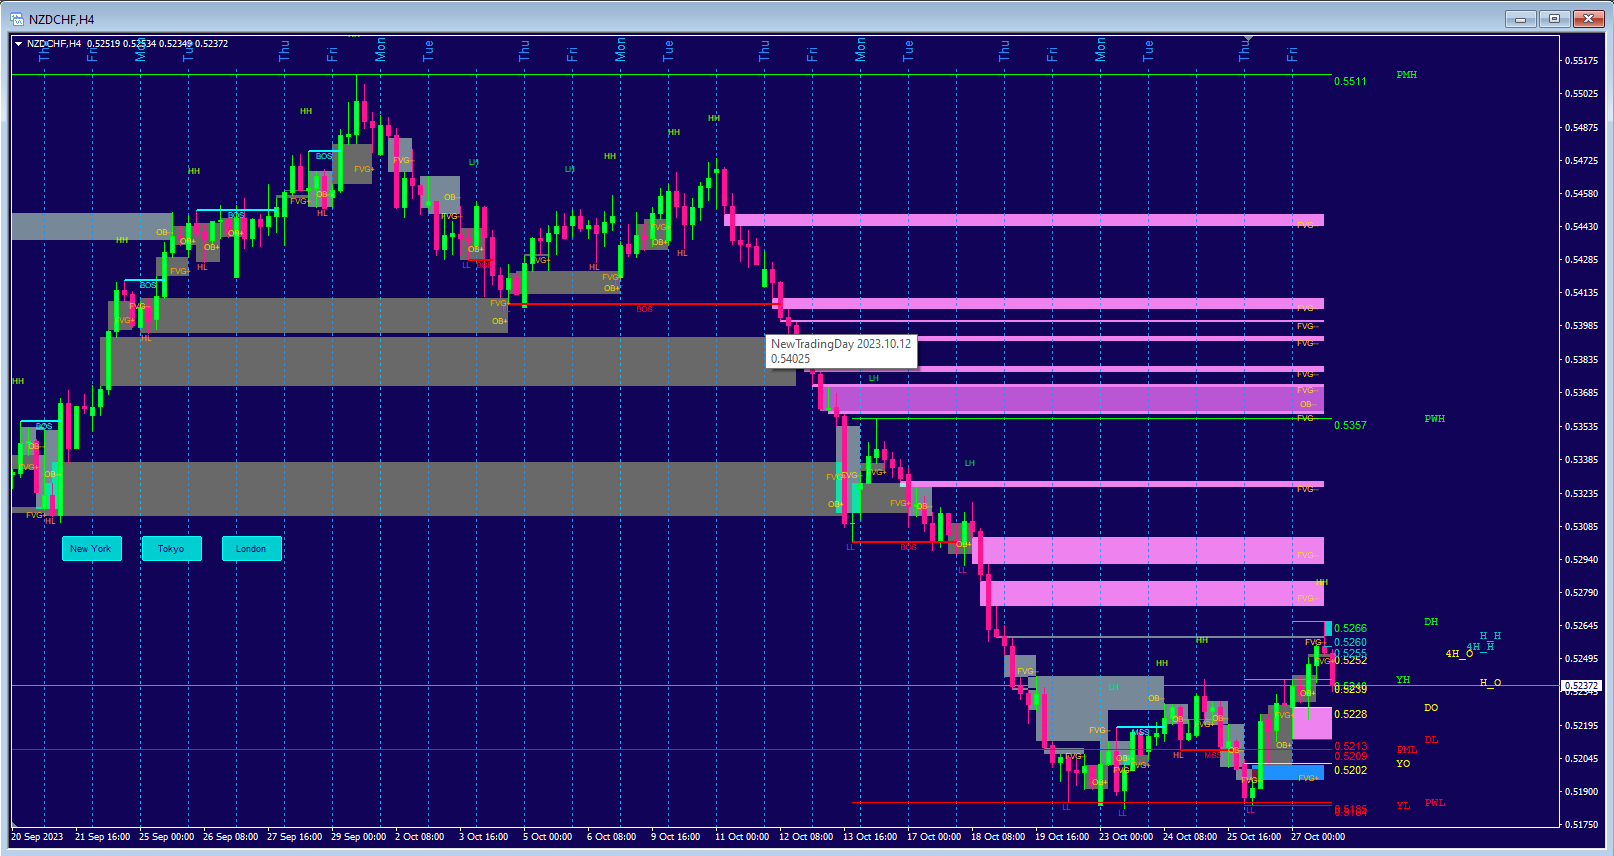
1.c ) Now we look at the 9th attached file, named "NZDCHF_4hOUR.png". It's the NZDCHF 4 Hour chart with my smart-market-structure features applied, showing the unfulfilled FVGs above the current price. And it shows clearly that from Oct 20th to Oct 25th, the first 4 trading days, the price was consolidating, with ATR < 40 pips.
And the last 2 trading days, Oct 26th and Oct 27th, the price has reached Higher High, and Higher Low, which the last 2 columns of ATR did show that they're 57 pips and 53 pips accordingly. The impulse move started trending up 2 days ago. From the 4-Hour chart, we can clearly see that it's a double-bottom chart on the 4-hour level, with a lot of FVGs ( Fair Value Gaps ) to be fulfilled in the coming days and weeks. The market structure has changed from going down to going up. ( It shows on the chart that the Monthly Low, and Weekly Low have been reached on the chart, and Smart Money stop hunt has taken most of the stops in these important bottom levels SSL( Sell Side Liquidity sweep ). Price is moving up to the BSL ( Buy Side Liquidity now ).
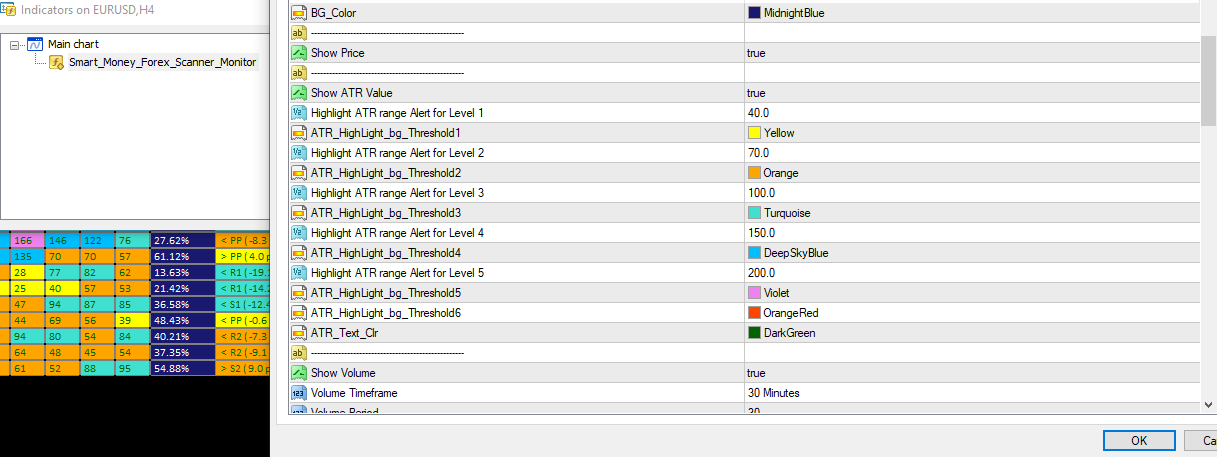
2.1 ) The 6 color settings for 6 custom levels of ATR, can be customized by the input screen. Now look at the 5th attached file, named ATR_Settings.png. All the pip distance levels can be set by the user, according to what he/she is more interested in trading at. ( For example, I have set the color to yellow when ATR is less than 30 pips in one day, and set the color to OrangeRed when ATR is greater than 200 pips in one day. ) The program is written for you to fit your trading style, and if you set the pip distance to be small, you'll know which pair is consolidating tightly. And when you set the ATR to be high, you'll know which pair has just finished a big trending move, and now it may need to consolidate and reverse soon.
2.2 ) The levels ( from 1 to 6 ) on the chart, that I have set as 40 pips to be Yellow, 70 pips to be Orange, 100 pips to be Turquoise, 150 pips to be DeepSkyBlue, 200 pips to be Violet color, can all be changed to the pip distance you like, and color you like to see. So you'll find the best trading opportunity based on your own trading timeframe, the time length you intend to hold the position, and your own trading style.
3.1 ) the 4th file "ATR_example.png" file, also shows the volume percentage column on the 30 minute timeframe. This column gives a glimpse view of the market activity levels of these forex pairs. You can change the timeframe for the volume to fit your needs. When volume is low, there is no need to trade or monitor, so you can go on with your trading day, taking care of other things. When volume is high, it tells you that prices are moving quickly and lots of trading opportunities are showing up. And you can custom set these different columns to find the entry for your trade.
4.1 ) There are 6 color settings for 6 custom levels of Higher-Level Highs and Lows on Version 2 of this scanner. Now look at the 6th attached file, named "DoubleTop_Bottom.png". I only show the last 2 columns in this chart for illustration purposes. ( for example, I have set the color to yellow when current price is less than 5 pips to a higher-level High/Low, and set the color to Orange when current price is in between 100 pips and 200 pips to a Higher-level High/Low. ) You can choose the pip distance in the input screen to fine-tune the level you want to be notified about.
4.2 ) For example, I have pre-set the pip distance to 5 pips for yellow color for Yesterday's High/Low, Today's High/Low, and Pivot columns. It'll be so easy to pick up the most accurate Double tops and Double bottoms for day-trading with the 5-pip setting, as color Yellow would highlight all the pairs in real time when price approaches Yesterday's High/Low, and Today's High/Low. It's just one more example on how to take advantage of the vast calculating power of this scanner for a day trader, to get the most accurate entry price without waiting anxiously for a long time for price to get to these levels. The levels that Smart Money uses for reversals on the daily basis.
5.1 ) With pivots, you can even set the pip distance to 1 or 2 pips to be notified with the color settings you prefer, and trade from one pivot level to another pivot level. Using the small pip distance to reach different pivot levels, would provide countless opportunities for day trading based on price move in between pivots for all these forex pairs. As price often go from one pivot level to another regularly. With one glance over the table, with the color highlight setting you pre-set, you'll be able to see which pair is only 1 or 2 pips away from a major pivot level and may reverse from that level imminently. It's a great tool to find super accurate entry opportunities without much waiting, with as many ways to use it at your disposal as your trading style prefers. You can play with it to find your edge through using it creatively. And super accurate entry point is half of the battle for trading success!
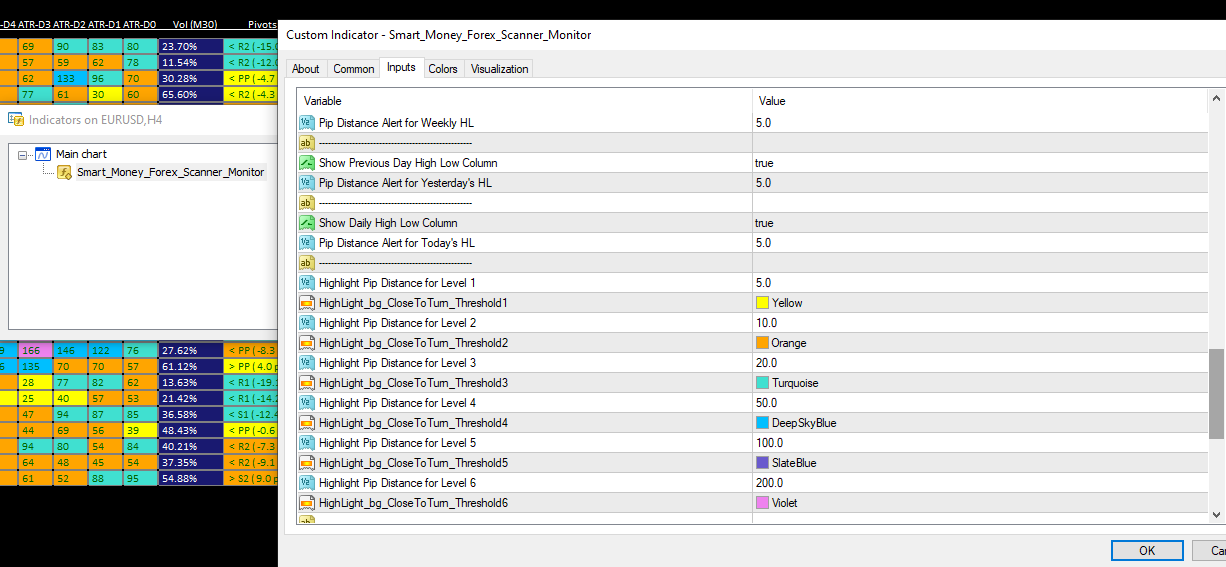
5.2 ) The 7th attached file, named "EqualHigh_Low.png", shows the input settings for pip distance settings and specific color settings correspondingly. On this chart, I have pre-set < 5 pips to a major price level to be Yellow, < 10 pips to be Orange, < 20 pips to be Turquoise, < 50 pips to be DeepSkyBlue, < 100 pips to be SlateBlue, and < 200 pips to be Violet color. Both these pip distances and colors can all be changed to the number of pips you like, and color you like to see. So total in all you'd have 6 pip distance levels you can play with, to see which would fit your trading style the best and provide the best trading opportunity for you.
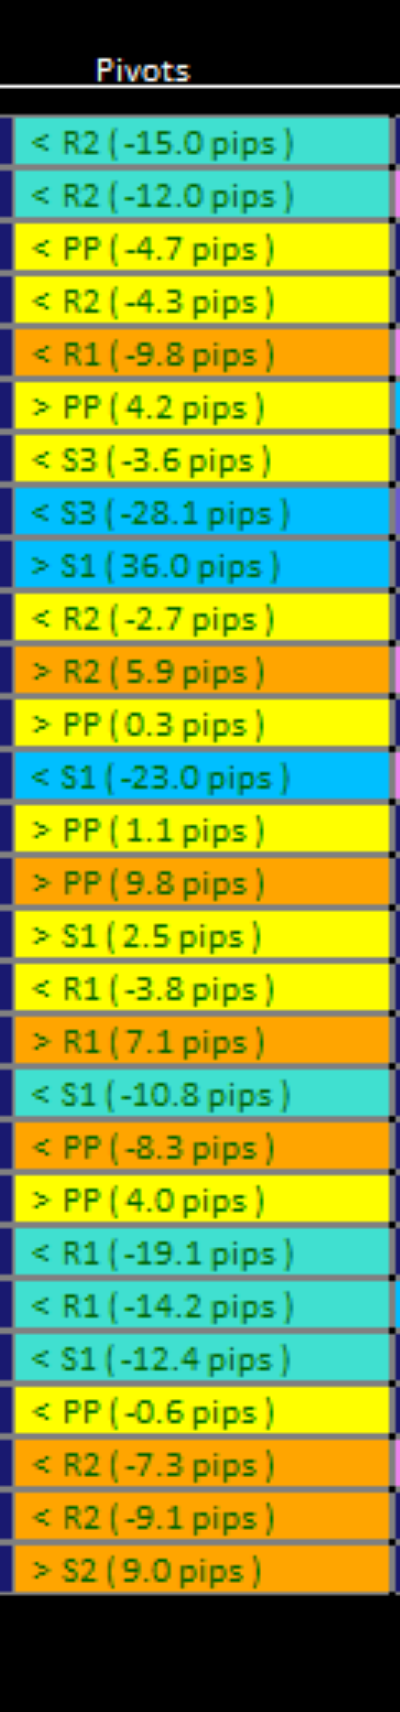
5.3 ) The 8th attached file, named "Pivots.png", shows the pip distance to these pivot levels for all forex pairs in real time. It's part of the 4th file "ATR_example.png", only shows the pivot column for easy viewing. As both files showed, the 4th row "AUDNZD" pair has yellow highlight on Pivot column, showing the current price is only 4.3 pips below R2 ( Resistance level 2 ). It means AUDNZD will quickly reach up to R2 in the next few minutes and would very much likely reverse once it reaches R2. ( With trading, it's all about probability over a large number of trades, not a single trade ). It just gives a great entry point for a high probability trade.
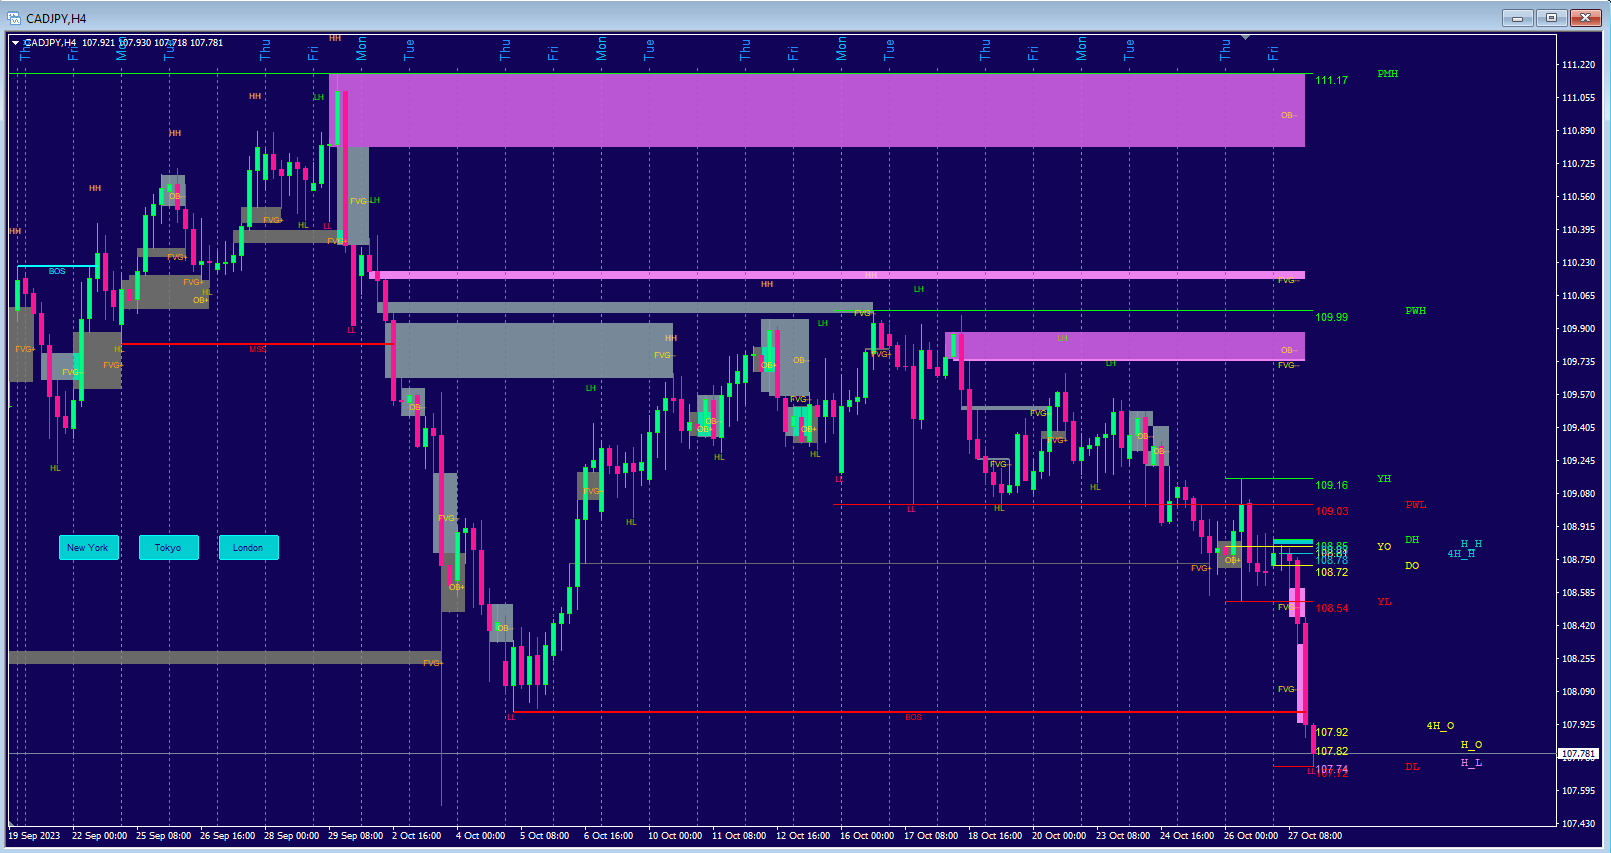
5.4 ) On the same chart, it also shows CADJPY is < 3.6 pips below S3 ( Support level 3 ). Now we can also look at the ATR at different days for CADJPY, and it shows clearly that the current day's ATR-D0 is 113, almost twice the average ATR levels of the other 5 trading days. It means after 5 days of consolidation, CADJPY has just had a big impulse move. Now let's look at the 10th attached file, named "CADJPY_4Hour.png" chart. It's the 4-Hour chart of CADJPY with smart-market-structure program features loaded up. And not surprising at all, the price at 107.78 on Oct 27th, 2023 for CADJPY, just formed a double bottom on the 4-hour chart, filled the OB ( OrderBlock ) on Oct 4th, had a BOS ( Break of Structure ) marked on the chart, and price is 22 pips below the last low of 108.00 which formed on Oct 5th. It proves multiple concepts of the Smart Market Concepts right here: Sell Side Liquidity, Stop Hunt ( or Turtle Soup, Juda's Swing ), Break of Market Structure, and etc. It also marked the unfulfilled FVGs ( Fair Value Gaps ) on the chart, to show where price may likely to go to in the near future to fulfill these gaps.
5.5 ) Smart Money Concepts are a comprehensive trading system, and when multiple factors all align and confirm with each other, the probability of trading success is much higher. These are great tools to help you in your endeavor in this journey and help you to achieve your success in trading!
https://www.mql5.com/en/market/product/106309
https://www.mql5.com/en/market/product/103576


