In modern trading, there are three main approaches to building trading systems:
- Charting Systems: In these systems, trading decisions are based on visual analysis of price charts displayed on a monitor screen.
- Computational Systems: This category includes various expert advisors based on indicators, neural algorithms, and other computational techniques
- News-Based Systems: These systems rely on analyzing global trends, news events, insider information, and other factors to make trading decisions.
Now, I would like to discuss some methods of constructing such visual reference levels.
MIGHTY MAKERS EA MT5
In modern trading, there are different types of levels that traders use as reference points on price and time charts. Let's explore some of these levels:
- Horizontal Levels: Horizontal lines on a chart represent price levels. Traders often identify significant support and resistance levels where price has historically reacted, reversed, or consolidated. These levels act as psychological barriers and can influence future price movements.
- Vertical Levels: Vertical lines represent time intervals on a chart. Traders may use these lines to mark important events, such as economic releases, news announcements, or specific trading sessions. Vertical levels help in understanding the timing and duration of market movements.
- Diagonal Levels: Diagonal lines, including trendlines or channels, indicate the change in price over time. They reflect the speed or slope of price movements. Traders use trendlines to identify the direction of the market and potential entry or exit points.
Other curved lines drawn by indicators or chart patterns can also fall under the category of diagonal levels. These lines capture the changing dynamics of price movements. Why do these levels work? One reason is that traders often buy and sell in markets with the goal of making profits. Additionally, periodic (oscillatory) systems inherently have a limited range of price oscillations, which can be observed in the markets. Moreover, people naturally like to make plans, and building plans based on known data is more reliable. For example, a simple yet effective trading strategy might involve buying an asset, holding it until its price doubles, and then selling it. Here, the "natural" price level is 100%. Traders may also consider protecting their capital by placing stop-loss orders if the price moves against their expectations. Some traders draw lines or bands on charts to mark the beginning and end of trends, assuming that the price will at least reach halfway toward the marked distance, given its initial movement. Traders place their orders at these levels to minimize risks. They prefer taking half of the potential profit rather than missing out entirely due to a sudden reversal. This thinking leads them to create a level at 50%. Each new or obvious idea based on common sense, supported by statistics and published findings, provides the basis for accumulating orders at specific zones. In most cases, these zones can be calculated, allowing traders to leverage the advantage provided by this knowledge.
By understanding and utilizing these different types of levels, traders can gain valuable insights and make informed trading decisions.
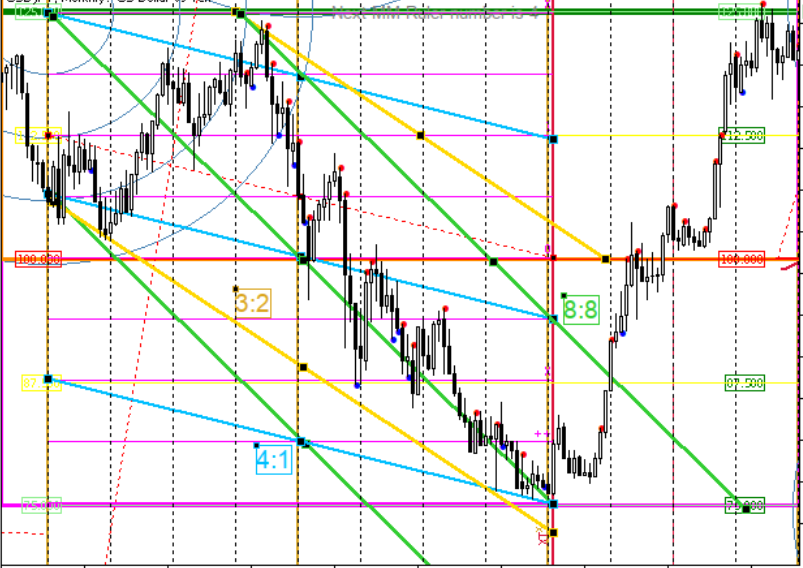
In the image you can see the speed of determining the levels to wait for its breakdown and enter the position.

Conflict Circles
Such phenomenon as "conflict circles" or "circles of contradiction" appear at intersections of levels 2/8, 4/8, 6/8 vertically and horizontally. In MetaTrader, you can draw such circles using the "Fibonacci Arcs".

This set of objects possesses at least one fascinating characteristic: if the price is moving within a range, it will not enter the small, innermost circle, let alone touch its center. However, if the price is in an active trending movement, the inner circle is more likely to be breached, and the price will touch its center. Following this, the price may reverse into a prolonged trend in the opposite direction, as seen in 2011, or continue further, as in 2007-2008. Nevertheless, when the price approaches the boundary of this circle, this information becomes highly significant across all timeframes.
Unfortunately or fortunately, I'm not sure, but in MetaTrader, the scale of circles does not adjust when changing timeframes. This means that each timeframe requires its own set of circles, and on the "Display" tab, it is necessary to disable the display of circles on all time ranges except the current one.
In this strategy, Murray Levels were utilized, which have proven to be highly effective in trading. These levels provide valuable insights into price movements and can help identify key support and resistance areas. By incorporating Murray Levels into the trading approach, traders can make more informed decisions and potentially improve their trading results.


Conclusion
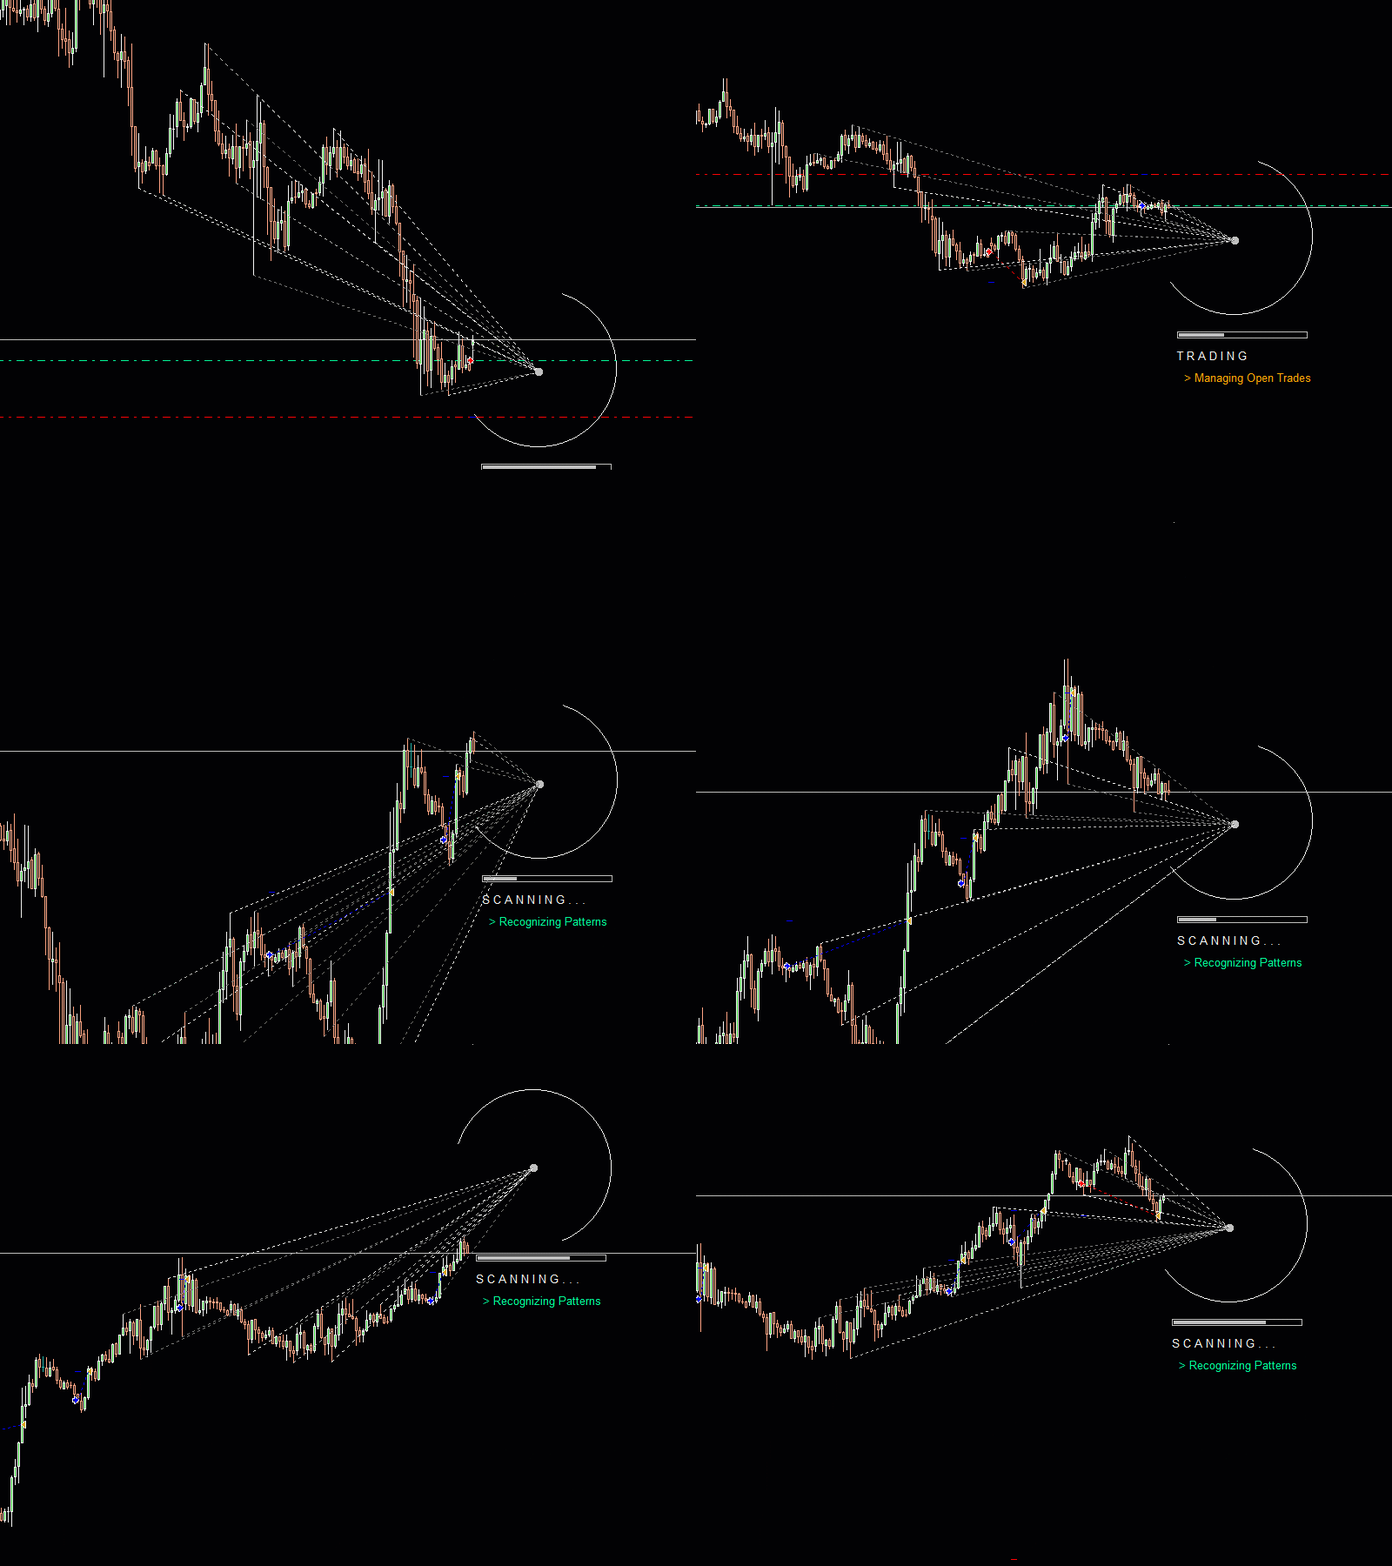
The Murray system provides traders with a versatile toolkit for assessing the current price position and making accurate trading decisions. It is not necessary to utilize every single tool presented here, but limiting oneself to only horizontal levels seems entirely misguided. Speed lines (diagonals), time lines (verticals), and conflict circles are powerful predictive instruments, and by incorporating them, traders can significantly enhance the accuracy of their trades, thereby increasing profits and reducing losses. The construction of these levels can be easily formalized (except for the construction of arcs, where finding a scaling method may be required), and once established, these levels will work for a long time, consistently providing precise entry signals. Additionally, in my advisor, I have integrated a neural network, which has further strengthened its capabilities. By combining the power of the Murray system with the intelligence of a neural network, the advisor can provide even more accurate and reliable trading signals. The neural network analyzes vast amounts of data and market trends in real-time, allowing the advisor to adapt to changing market conditions and stay ahead of the curve. With this enhanced functionality, the advisor becomes a formidable tool for traders seeking to optimize their trading strategies and achieve consistent profitability.


